


By James Catlin

Overview
An oversupply of container vessels has plagued the market over the past couple years. But late 2016 through the first half of 2017 saw robust demand for these ships as the global economy picked up the pace. This led to speculation that the container shipping segment was on the road to recovery.
But the back half of 2017 saw rates decline again even, as demand remained relatively strong. While we have seen a bit of an uptick to start 2018 there is still a large order book set to hit the water which the market may find difficult to digest.
The main damage to the container shipping segment was brought on by a massive influx of Ultra Large Container Vessels, ULCVs, so we will focus our attention there.
Some of the container ship companies traded in the U.S. market include Sea span Corporation (NYSE:SSW), Costamare, Inc. (NYSE:CMRE), Diana Containerships, Inc. (NASDAQ:DCIX), Global Ship Lease, Inc. (NYSE:GSL), Danaos Corporation (NYSE:DAC), Ship Finance International Limited (NYSE:SFL), and Navios Maritime Partners L.P. (NYSE:NMM).
Ordering Spree
Since my last container shipping supply side update in July of 2017 quite a few orders have been placed which has added to the concern surrounding the already thick order book.
From January through July of 2017, orders were kept largely under control with just 14 firm orders and two options placed over that time, all for vessels of 2,525 TEU or less. Owners were exercising an enormous amount of restraint as the industry struggled to cope with the oversupply situation.
But this restraint ended in a big way throughout the back half of 2017 when an exceptionally high number of vessels were contracted, many of which were ULCVs.
From August through December, there were 69 firm orders with 7 additional options. Many of these were smaller vessels, such as feeders, handy class, and sub-Panamax. But there were also five orders for 11,000 TEU vessels, six orders for 14,000 TEU vessels, and 20 orders for 22,000 TEU vessels with 3 additional options. The vast majority of these are set for delivery in 2019 and 2020 and the addition of these vessels has altered the outlook.
Not only must we reassess the outlook based on these orders, but a high degree of deliveries over 2018 will further add to the supply woes for the segment before these new orders even hit the water.
2018 Incoming
Let’s start with a bit of history to put these upcoming deliveries in context. The current depressed charter market can be traced to the addition of several ULCVs starting in 2014.
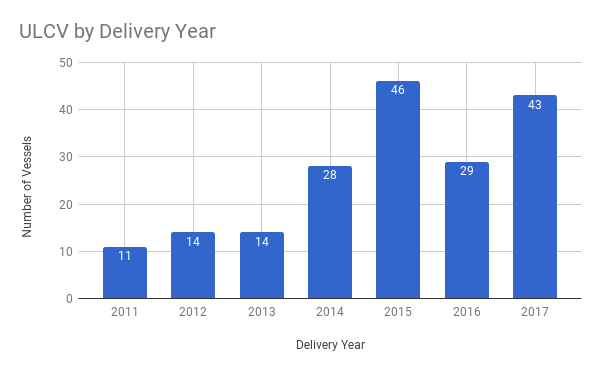
Source: Data Courtesy of VesselsValue, Chart by James Catlin
On the surface, these numbers don’t look too staggering but when we dive into the number of TEU they represent, it’s a different story.
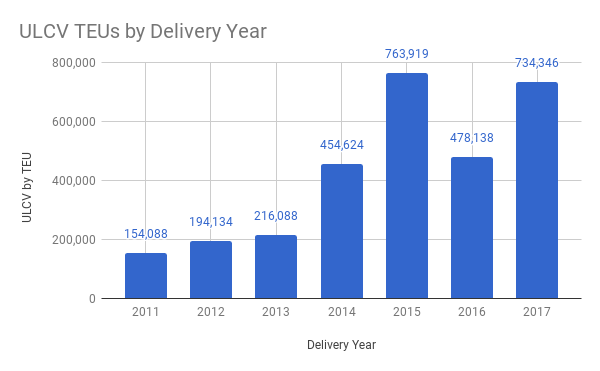
Source: Data Courtesy of VesselsValue, Chart by James Catlin
Now let’s recall how these deliveries impacted the segment. Over the course of 2015, we saw rates collapse by approximately 75% across the board. While they have bounced back a tiny bit, thanks in part to layups, consolidation, bankruptcies, and an uptick in demand they still are a fraction of what they were prior to this recent delivery cycle.
So why I am so concerned about 2018?
Well, let’s take a look at the number of vessels expected over the course of 2018 in the ULCV class, as well as TEU.
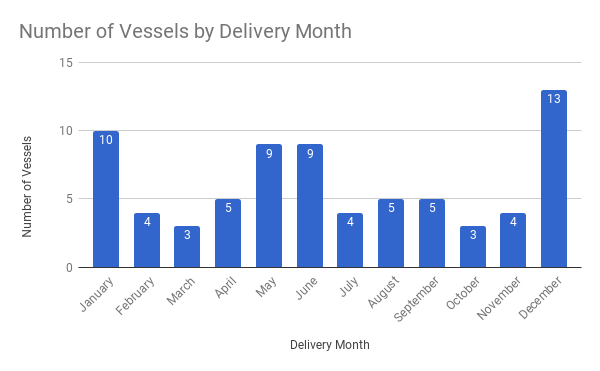
Source: Data Courtesy of VesselsValue, Chart by James Catlin
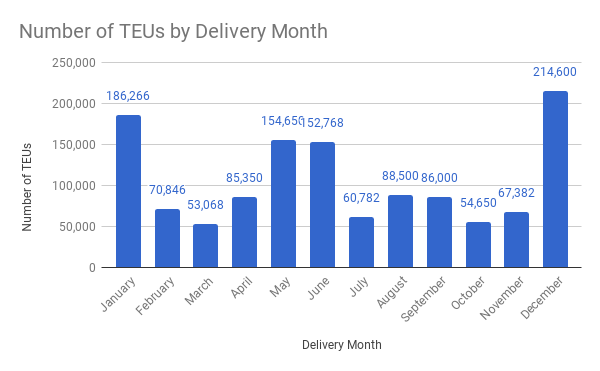
Source: Data Courtesy of VesselsValue, Chart by James Catlin
There are 74 deliveries of ULCVs scheduled for 2018 representing 1,274,862 TEU that will hit the water. That’s two vessels and 62,378 TEU more than 2016 and 2017 combined.
Now if we were to add up the expected TEU across all classes that come out to 1,978,932. This comes out to approximate gross TEU growth of 9.5%. Accounting for slippage and expected demolitions will likely put net fleet growth closer to 1.4 million TEU which still represents 6.7% net growth. This supply side growth eclipses the robust demand side activity we have seen as of late.
Of course, owners are currently attempting to balance deliveries, as noted in my last article, but as recent history shows, even a slight imbalance can send rates lower.
Utilization
Many of these ULCVs are scheduled to service Asia to Europe trading route. The Shanghai Shipping Exchange, SSE, not only keeps track of rates for certain routes but also gives updates on utilization.
Looking back over their weekly reports we see that utilization rates below 95% for this route has been the main catalyst for an overall drop in rates. In the back half of 2017 when rates began to turn down the SSE reported that the Europe route saw the average slot utilization rate leaving off Shanghai Port is between 90%-95%.
A seemingly small decline such as this actually had a large impact on the market. This was because in order to sustain market share box liners decreased booking rates which in turn caused spot rates to slip.
Around this time other route utilization rates like those in North America, Persian Gulf, Australia, Africa, Japan, and South America remained relatively stable.
For a short time, we saw utilization rates for North America hit close to 100%, but this coincided with sub 90% utilization rates for the Europe route. This uneven performance caused rates to “tumble” according to the SSE proving once again that the Asia to Europe route remained the most important indicator.
During that time the SSE reported that this low utilization was brought on by a large number of vessels hitting this trading lane increasing “competition among box liners”.
Recently rates have started to climb again, with utilization rates again approaching 95%. But, with the highest number of deliveries set to hit the water in 2018, and three-quarters of those ULCVs destined to hit the Asia-Europe route it becomes likely that utilization rates will again see pressure over the course of the year.
Could High Interest Rates Impact Box ship Demand?
Recently we have seen some market turmoil with many tracing it to expectations of interest rate increases. Much of that was brought on by data out of the USA with regard to healthy economic conditions fostering low unemployment and high wage growth.
But Europe won’t be far behind. Strong economic conditions led to robust demand out of Europe for container vessels, which was the main factor in the bump in rates we saw recently. But that same strength could also lead to a speedier end to the ECB’s supportive stimulus measures and thus lead to higher interest rates designed to head off any potential inflation threat.
For the most part, container vessels carry finished goods destined for the retail market. Inventories for the retail market are somewhat interest rate sensitive.
The reason behind that is simple. Interest expense is a component of the income statement. Many companies pay their lender prime plus or Libor plus a negotiated rate. Any rate increase will cause a ripple effect on everyone who borrows. If a company’s loan averages $5 million, its interest cost would be $50,000 higher if rates were to increase by 1 percent. With limited ability to pass this on to consumers in a very competitive retail environment that is already highly leveraged, companies may find themselves operating on a smaller scale to meet their higher operating expenses.
Obviously, this would impact container shipping demand if collectively carried out on a large scale. Container shipping is potentially the second most interest rate sensitive segment behind the Ro-Ro’s, which focus on car and truck transport.
IMO Mandate Will Have Minimal Impact
Other segments might be able to explain a hefty order book as of late as they prepare for the phasing out of vessels earlier than what would normally be anticipated courtesy of two IMO mandates. The Ballast Water Management Convention will require a significant investment in vessels while the 2020 Sulfur Cap will either require additional investment or the use of far more expensive bunker fuel.
Many expect greater demolition activity as a result of these mandates across many segments, but the ULCV’s won’t be part of the equation due to their high cost and relatively young age.
In fact, the average age of the ULCV fleet is just two years. Owners will be highly unlikely to scrap any of these vessels, the oldest of which is just 12 years old.
The next size down from the ULCV’s, the New Panamax (10,300-13,399 TEU range) presents the same problem with the average age being just 4 years old, with the oldest being just 10 years of age.
Beyond that is where the scrapping potential begins but prospects are still very thin. In the 3,000-10,299 TEU range, we have just 849,029 TEU built in 2000 or before and not all of those will be heading to the scrapyard, especially the larger ones. In fact, the catastrophic market of 2016 has already led owners to part with quite a bit of tonnage thinning out demo prospects well ahead of these mandates.
Conclusion
2018 is set to be the busiest delivery year in this latest delivery cycle. While robust demand has mitigated much of the damage in the back half of 2016 and into 2017, the current projections look to overwhelm the strong demand seen lately.
Even a slight drop in utilization for the key Asia-Europe route looks to have a significant impact on rates. This route will receive the majority of these upcoming deliveries which should lead to problems on this front and in turn the overall market.
Adding to the complexity of this equation is the prospect of stronger growth leading to increasing interest rates which could impact retail inventories.
Finally, there appears to be little relief in the form of potential demolitions. Even the upcoming IMO mandates, which look to inspire greater scrapping in several other segments, should have minimal impact on the container shipping segment meaning these delivers will continue to create quite a hangover for some time ahead.
Deliveries look to be slowing down in 2019 and 2020 allowing the market time to digest the recent wave of orders hitting the water, so there is some hope ahead. But in the near term, it appears that the market will still be under pressure unless the demand side again surprises to the upside beyond the expected supply increases, which given historical records appears highly unlikely.
Did you subscribe for our daily newsletter?
It’s Free! Click here to Subscribe!
Source: Seeking Alpha


