


 x
x
While the Q4 rally was enjoyed by all classes of tankers, including those from the product tanker segment, one particular crude carrying class has had been impacted by the anticipated seasonal slowdown in a more acute manner than their cohorts. This has prompted me to look deeper into the issue as it seems this weakness would likely have a structural component at work as well, writes James Catlin in an article published in Seeking Alpha.
Tanker Rates
First, let’s take a look at rates for the tanker classes.
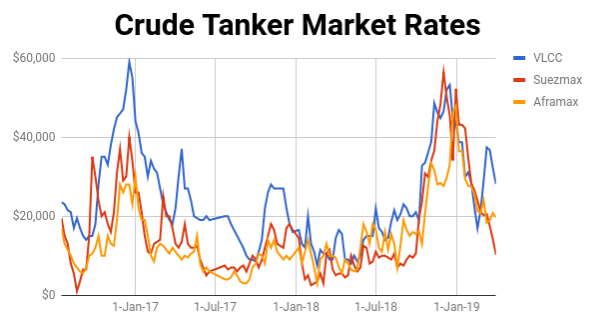 Source: Value Investor’s Edge
The Suezmax class has found itself in a downward trajectory with little resistance offered.
VesselsValue reports Suezmax spot rates at just $3,591/day as of March 26th for the benchmark TD20 route, rebounding from the recent low of $2,577 on March 22nd. That’s quite a decline from Q4’s peak of over $42k/day.
This weakness, it turns out, can be attributed to many causes.
Supply
- We were already looking at a busy year for Suezmax deliveries with 31 new vessels expected to hit the water, representing about 5.8% gross fleet growth on the year.
- But those deliveries came fast and furious during the first quarter of 2019.
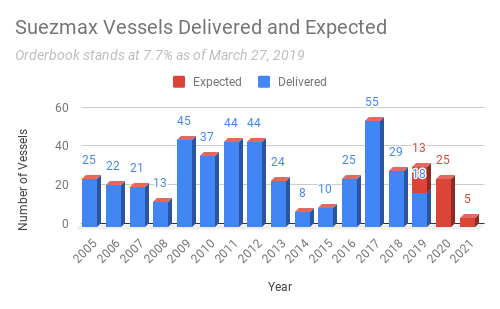 Source: Data Courtesy of VesselsValue – Chart by ShipBrief
- Already 18 of the expected 31 Suezmaxes have hit the water. By contrast, only 18 of the expected 77 VLCC’s and 13 of 44 Aframaxes have gone live.
This front loaded delivery schedule for the Suezmax class outpaced demand growth in a spectacular fashion, and can be cited as the first factor guiding the class toward depressed charter rates.
The good news is that deliveries in this class are expected to slow and return to a more normalized pace with several of the remaining vessels scheduled for launch toward the back half of the year.
Additionally, while the back half of 2018 saw renewed interest in Suezmax newbuilds, there have only been a couple orders placed in 2019 giving hope that 2020’s delivery schedule may not change radically at this point.
Scrapping Down
But lack of activity in the newbuild department was matched by that of the demolition market where just a couple of vessels have been reported as scrapped so far this year. Therefore, the net gain in tonnage for just the first three months of 2019 comes in at about 3%.
This pace of supply growth will not be matched going forward. This influx of vessels presents short term supply side shock which will be absorbed over the coming months – if the demand side holds up its end of the bargain.
Demand
That last statement is key. The demand growth must be there to continually absorb net fleet growth. Currently, the Suezmax class finds itself in a bit of a funk.
Now, before we go forward, this demand-side analysis is short term in nature to help us understand the issues behind the latest move. Forward shifts like the 2020 Sulfur Cap will be addressed separately.
Trade dynamics and volumes are constantly changing. For proof of that we look no further than the Suezmax class. Here we’ll take a look at the latest 3 months (Thu 27 Dec 2018 – Wed 27 Mar 2019) and compare that to the same 3 month period one year ago (Thu 27 Dec 2017 – Wed 27 Mar 2018).
Using VesselsValue tracking data, we observe that over the past three months that 194,120,697 mt of cargo was shipped totaling a distance of 4,289,795 nautical miles. Ton miles totaled 617.35 bn DWT NM.
But one year ago, we had much more activity with 211,440,947 mt of cargo shipped totaling 4,612,319 nautical miles. This put total ton miles at 661.26 bn DWT NM.
This represents a 6.7% reduction in ton miles traveled over that same period.
But these stats are just the beginning when it comes to understanding the current situation. The real question should be “what is driving this shift?”
The Driving factors
- The main driver as it turns out is a shifting trade dynamic which involves the U.S. and African crude, specifically Nigerian crude for the most part.
- Nigeria uses Suezmax vessels exclusively for all crude exports, and shipments have been declining.
- In fact, according to VesselsValue, in January of 2018 Nigeria crude exports racked up a total of 32.74 bn DWT NM of travel.
- However, in January of 2019 ton miles had dropped considerably to just 25.16 bn DWT NM.
- The latest weekly loading schedules are not looking good with just 6 reported over the March 17-23 period, the lowest since the start of the year.
- Furthermore, toward the end of March, about 15 Nigerian cargoes from April loading program were still available, according to Reuters.
- The OPEC cuts seem to be weighing on export volumes. OPEC asked Nigeria to cut its crude oil production by 3.04% to 1.685 million bpd (excluding condensates) for the first half of 2019.
- The nation’s crude oil production including condensate fell to 1.999 mbpd in January from 2.081 mbpd in December.
Infrastructure Problems
- Some infrastructure problems can also be blamed, such as the explosion in early March which forced the shutdown of the Nembe Creek Trunk Line, one of the major crude oil transportation channels used for export.
- The NCTL, which is 100 km long and has a capacity of 150,000 bpd at Nembe Creek, evacuates crude to the Bonny Crude Oil Terminal.
Competition from US
Let’s also not forget that Nigeria is facing stiff competition from the U.S. which produces light sweet crude of similar quality. Not only does this hurt Nigerian imports into the U.S. but it is also impacting demand for Nigerian crude from other markets which are substituting U.S. crude.
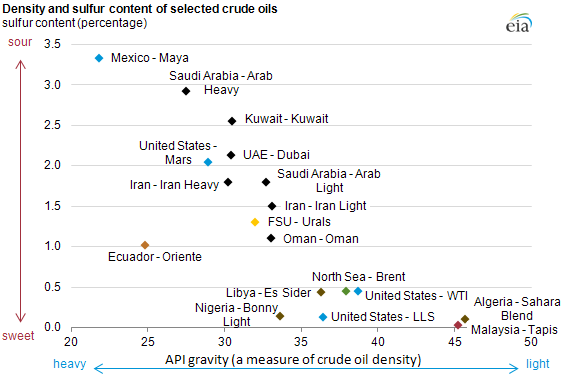 Source: Wikipedia
- With U.S. production up, Nigerian exports to the U.S. have fallen significantly.
- In 2018 Nigerian crude volumes fell by approximately 43%, down to 64.06 million barrels from a five-year high of 112.92 million barrels in 2017. 2019 is seeing a continuation of that trend.
- The Nigeria-US trade route is crucial to Suezmax demand as in 2018 it represented the second largest source of ton mile demand during the three month period cited above. Ton miles over that period came in at 18.99 bn DWT NM.
- But this year that same three months saw that route drop to the 17th spot with total ton miles at just 5.99 bn DWT NM.
- That’s a drop of about 13 bn DWT NM traveled for just this single route, representing a 2.9% drop in total ton miles traveled from the 2018 period.
- It’s not just the Nigeria/US trade that is suffering.
- In the 2018 period, Nigeria actually held 5 of the top 13 spots when it came to Suezmax ton miles traveled. But 2019 saw that number drop to just 2 of the top 13 spots.
Demand for Nigerian crude has been impacted by a surge in U.S. oil production. With the sharp increase in its production, the U.S. oil exports averaged 1.9 million bpd in 2018, about twice the amount that was exported in 2017. Shipments overseas have leapt since the U.S. lifted restrictions on exports that had been in place since the Arab oil embargoes of the 1970s.
Other Impact of Surging US Crude
Surging U.S. crude output has made West Texas Intermediate oil relatively cheap compared with the international benchmark, Brent.
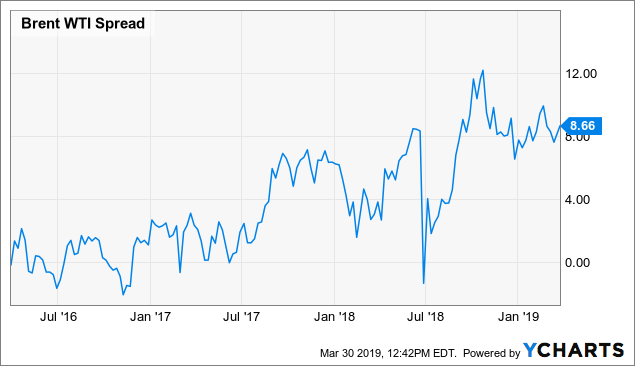
With two similar qualities being traded at a large price differential, the gap has been more than enough to offset the increased shipping costs.
A top importer of Nigerian crude, India, has taken notice. In fact, India was Nigeria’s top crude oil buyer in five of the last six years.
Rising steadily in 2018, U.S. oil this past October accounted for about 3% of India’s overall imports, while the share of African crude fell to about 10.5%, the lowest since November, 2012.
Price and secure availability are prompting this short term shift, but over the long term, India’s new and expanded refineries are geared towards processing heavier oil from the Middle East. So one of the fastest growing import dependent markets, India, will see stiff competition from the U.S. coupled with refinery needs dampening Nigerian prospects.
In mid March it was announced that India signed an agreement to import 0.6 million barrels of oil from the United States, Nigeria’s crude exports could further be threatened if new markets are not explored.
This trend of replacing African for U.S. is not unique to India. Recently, crude oil exports from the United States to the United Kingdom overtook supplies from other countries including Nigeria for the first time since such shipments began in 2015.
Longer Ton-Miles Anticipated
U.S. exports replacing Nigerian will typically result in longer ton miles traveled, but those ton miles are coming on VLCCs for the most part. This would help to explain the growing divergence between VLCC rates and those of Suezmax, which once again on March 26th came in at $25,034 and $3,591, respectively.
Other trade flow shifts of note include a significant drop in Mexico-Spain volumes, which in the 2018 period cited came in at the number three spot. The latest three month period saw that route fall to the fifth spot as Mexico continues to face headwinds.
Higher Aframax Divergence Rates
Finally, we note that Iran once held numerous top spots, but is now largely absent due to sanctions.
While Russia has been exporting more crude, utilizing some Suezmax tonnage (though they seem to prefer Aframax), it hasn’t been nearly enough to offset all the declines.
Therefore, as Suezmax volumes have declined, the U.S. and Russia have picked up the slack utilizing mostly VLCC’s and Aframaxes, respectively. This again explains the divergence in rates between the classes with Aframax rates currently about 30% higher than that of Suezmaxes.
Delivery Schedule Causing The Problem
A front-loaded delivery schedule coupled with waning demand have caused Suezmax rates to fall considerably.
The supply influx is a temporary issue and deliveries will slow as the year progresses. Next year’s delivery schedule is far more acceptable and won’t present nearly as much of an issue as it has over the past few years.
But now, just as the supply side issues are clearing up, we are seeing demand side issues starting to creep into the picture.
- The Suezmax class is heavily dependent on Africa as these vessels were specifically designed with navigating the Suez Canal in mind.
- As such, port infrastructure built for the region reflected this reality.
- This means that vessel substitutions out of this region aren’t terribly likely. As Africa goes, so to does the Suezmax market.
- Nigerian exports are constrained now by both infrastructure issues and OPEC cuts. Both of these are likely temporary and the timeline is uncertain.
- Fierce competition from the U.S. for similar crude has also put a damper on Nigerian exports.
- This is likely a longer term issue unless we see another extreme oil shock which depresses prices enough to where short-cycle swing producers in the U.S. begin to cut output.
Increased Oil Demand Likely
But the back half of the year will see increased oil demand courtesy of the 2020 Sulfur Cap. With medium distillates in focus this could breathe some life into demand for Nigerian crude. Additionally, it is likely we will see some slightly more aggressive retirements of Suezmax vessels as both rates and the 2020 Cap weigh on owner’s pocketbooks.
Structural Issues at Work
The latest slide in Suezmax rates goes beyond seasonality. There are structural issues at work. Some short term, some indefinite, and some long term. However, this move is likely overdone and a correction to more reasonable rates, which still reflect some challenges, seems rational. Though we must remember, that as of right now, trade dynamics aren’t favorable for Suezmaxes so any correction will likely reflect that reality.
Did you subscribe to our daily newsletter?
It’s Free! Click here to Subscribe!
Source: Seeking Alpha


