 While higher exports from the US to China under the Phase One Agreement have added volumes for tanker and dry bulk shipping, containerized imports to the US have shifted from China to other countries in the region, says an article published in Bimco.
Trade balance improved
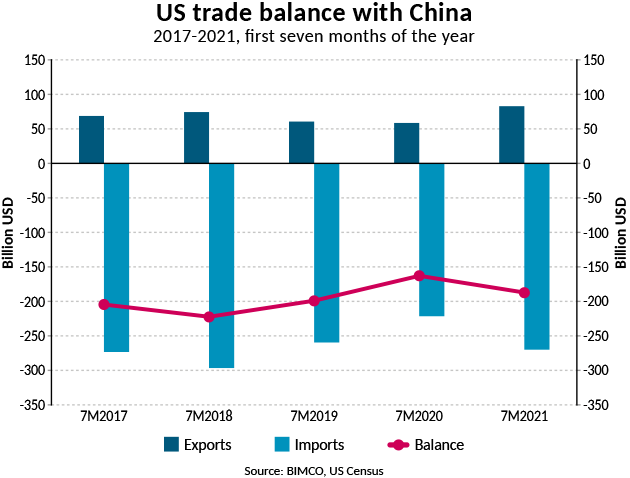
In the first seven months of 2021, the US trade balance with China has worsened compared with the same period in 2020, from a deficit of USD 162.8 billion to a deficit of USD 187.2 billion. However, the first seven months of 2020 were severely impacted by the pandemic, creating an artificially low deficit. Compared with 2019, the trade balance has in fact improved in the first seven months of this year, aided by higher valued exports.
US exports in value to China have risen 34.7% in the first seven months of 2021 compared to 2019, and at USD 72.4 billion, exports this year are 14.1% higher than in the same period of 2017 before trade war tariffs were implemented. While total imports measured in value from China are also up from 2019 (+4.0%), the total value of imports is down 1.2% in the first seven months of this year compared to the same period in 2017 (2017 being the final pre-trade war year).
Out of total US trade, imports from China have in the first seven months of 2021 accounted for 17.2% of total US imports, down from 20.6% in the first seven months of 2017. Exports to China have made up 8.7% of total exports so far this year.
Exports to China rising faster than to the rest of the world
Partly attributable to the Phase One Agreement, boosting US exports to China and repairing some of the damage done to trade between the world’s largest economies in the first years of the trade war, US exports to China have risen at a faster pace than those to the rest of the world. In the first seven months of this year, US exports to China are up 40.6%, almost twice the 22.2% export growth rate recorded in the same period to the rest of the world. The strongest growth has come from energy products and agricultural goods, with US containerized goods exports suffering both from the slow recovery in manufacturing as well as problems in getting goods exported.
The contrast between the two is even starker when comparing exports so far this year to those in the first seven months of 2019: exports to China are up 34.7%, while those to the rest of the world are up by just 0.2%. This has led to China taking a larger share of total US exports than it did in 2019 and has in fact recovered to its pre-trade war level. In the first seven months of 2021, the US sent 8.7% of its exports to China, slightly above the 8.5% from the same period in 2017.
Growth was driven by goods covered in the Phase One Agreement
Just under three-quarters of total US exports to China are covered in the Phase One Agreement, and these quarters have been the major growth driver. Compared to the first seven months of 2020, exports of both goods included in the agreement, and those that aren’t, have increased. Compared to 2019, however, exports of goods not covered in the deal have fallen by 6.1%. This compares to 61.1% growth in exports of the goods included in the agreement.
For seaborne trade, all three of the major shipping sectors have benefitted from higher exports on this long-haul trade as they are all covered by at least one of the categories of goods covered in the agreement: manufactured, agricultural and energy goods. The biggest winners are tanker and dry bulk shipping. The extra container volumes are being added on the backhaul transpacific trip.
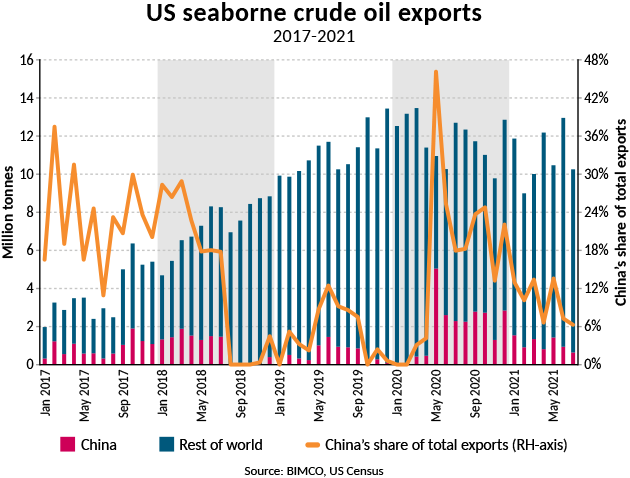
The most important commodity in the agreement for tanker shipping is crude oil, with 7.6m tonnes exported so far this year, just under 10% of total US seaborne crude oil exports. Although this, in volume terms, represents an increase from the first seven months of 2017 and shows much improvement from the second half of 2018 and the whole of 2019 in which there were many months with no imports, China has yet to return to the market share it held before the trade war when the country accounted for more than one-fifth of US crude oil exports.
Overall, exports of the energy goods included in the agreement have risen by 470.5% from the first seven months of 2020. This jump is attributable to a recovery in volumes as well as stronger energy prices. Compared to the first seven months of 2017, the value of exports of these energy goods to China has risen by 64.3%.
Corn is the biggest volume driver for dry bulk shipping
Dry bulk shipping has also benefitted from an increase in trade between the two hotspots. The strongest growth has come from US exports of corn which have grown from under 1 million tonnes in the first seven months of last year to 15.4m tonnes in 2021. Another large dry bulk good covered in the agreement is coal, of which 6.1 million tonnes have been exported to China. In the first seven months of the past four years, US coal exports to China have averaged 1.2m tonnes.
Another of the important dry bulk commodities included in the deal is soya beans. As the US export season is ramping up, this provides support to the mid-sized bulkers that cater to this trade. However, BIMCO does not expect soya bean exports this season to match the record-high volumes from the 2020/2021 season.
Also included in the agreement is a long list of manufactured goods, and exports of these goods have increased at the slowest pace of the three groups of goods. This is due to the US manufacturing sector recovering from the pandemic at a slower pace than other sectors. Compared to the first seven months of 2020, the value of exports of the manufactured goods included in the agreement is up by 21.3%.
“Despite the higher value and volumes, exports this year are still far from the commitments made in the agreement. In fact, it looks increasingly unlikely that the targets will be met by the end of the year. However, even if the agreement’s targets are not met, the higher exports from the US to China have added volumes and important tonne-mile demand to a struggling oil tanker shipping industry while also boosting the strong dry bulk market,” says Peter Sand, BIMCO’s Chief Shipping Analyst.
In the first seven months of this year exports of the goods in the Phase, One Agreement has reached 21.3% of the commitments made for the full year. Just as in 2020 the agricultural goods have come the closest to meeting their goal, though at 30.4% they are still far from the target.
Tariffs have capped growth in imports from China
While exports have benefitted from the Phase One Agreement, US imports from China continue to face higher tariffs with containerized goods affected the most. Comparing the first seven months of 2021 with the first seven months of 2020, the tariffs have left China with a much lower growth rate than other countries in the region.
During the first seven months of this year, strong growth has been recorded in containerized imports by the US from the region, as evidenced by the congestion on the Transpacific trade, but the tariffs have left China with a much lower growth rate than its neighbors.
Containerized imports by the Far East and Southeast Asian countries have risen by 18.3% between the first seven months of 2017 and the same period this year, reaching 63.3 million tonnes. In contrast, China’s imports stand at only 2.8% growth compared to 2017, rising by just under 1 million tonnes to 36.1m. Volumes from the other countries in the region have grown much faster, up 48.5%, which at 27.3 million tonnes is however still overshadowed by China.
Compared to the first seven months of last year, growth is much more evenly distributed between China and the other countries in the region, with total containerized volumes up 26.7%, following the large drop in imports at the start of last year. In this period, China has recorded a growth of 29.6% compared to a growth of 23.1% from the other countries in the region.
The strongest growth comes from Cambodia, Burma, and Vietnam, with the latter solidifying its second spot behind China. The US has imported 7.3m tonnes of containerized goods from Vietnam so far this year.
“Even before the pandemic induced to talk of supply chain resiliency, US importers had been adapting to the changing geopolitical situation, with China’s neighbors, rather than US manufacturers, emerging as the biggest winners. There are however still huge volumes of goods being imported from China despite the higher tariffs being applied, paid for by US consumers. While originally these may have avoided being passed on to consumers, this may now be inevitable as higher supply chain costs squeeze margins even further,” says Sand.
Did you subscribe to our daily newsletter?


