By James Catlin
Summary
- Over the last couple years, the VLCC fleet has experienced significant growth leading to the current oversupply situation.
- A thick orderbook looks to keep the market saturated with tonnage over the next two years.
- Here we will take a look at the supply side as well as some other factors set to influence the VLCC market.
Overview
VLCC stands for Very Large Crude Carrier and they typically transport approximately 2,000,000 barrels of oil. Companies engaged in the ownership of these vessels include DHT Holdings, Euronav, Frontline, Gener8 Maritime Inc., Navios Maritime Midstream Partners L.P., International Seaways, and Ship Finance International Limited.
Background
The crude tanker market has been under pressure lately due to an influx of vessels hitting the water which have increased vessel supply at a faster rate than demand growth for seaborne crude imports. This growing disequilibrium has been largely responsible for the decline in charter rates.
Back in May of 2017 I wrote an article entitled VLCC Orders Continue To Pile Up, which concluded:
A correction for this disequilibrium looked to be on the horizon for 2018-2019 but a recent flurry of orders has called that timeline into question. 2017 has already seen more than double the orders placed in 2016 and there are still 235 days left in the year.
Many of those orders placed in or before May are set to hit the water in the back half of 2018 and in early 2019, further delaying market recovery prospects.
For a while after things were quiet with just a handful of orders placed in June – August. But September saw another flurry of activity which lasted through the end of the year as 24 firm orders piled up with options for five additional vessels.
At one point in 2017, the orderbook fell to just 10% of the live fleet. But for vessels ranging from 200k-600k dwt that number is back up to 14.5%, which would be acceptable in a healthy market, however, with spot rates on January 26th at under $10k/day this market is anything but healthy.
Here we’ll take a closer look at the current orderbook and another key factor which has played into the poor market.
Supply Side
It’s always good to start with a bit of context. So let’s go back in order to gain some perspective on the magnitude of this incoming tonnage.
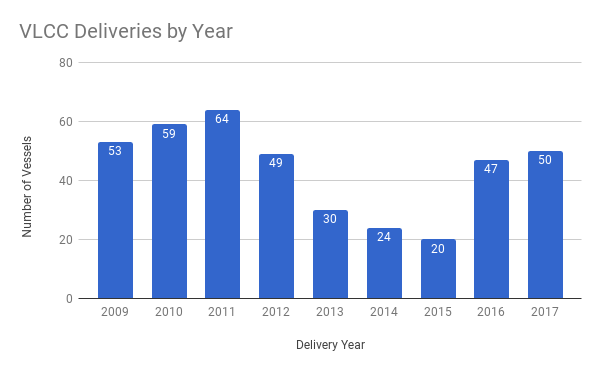
First let’s take a look at deliveries over recent years before we examine how they have impacted the market.
Source: Data Courtesy of VesselsValue, Chart by James Catlin
Leading up to the global recession the crude tanker segment was booming and charter rates were attractive to say the least. This lured owners into placing orders for vessels to capitalize on what they expected to be a prolonged bull market.
But, too many ships being ordered prior to the 2008 crash to supply a commodity demand boom that was unsustainable in the long run, created a massive oversupply which outstripped post-boom demand. Due to the lengthy nature of the shipbuilding process and the backlog in many shipyards that spanned several years, these deliveries kept coming through 2012.
But there was another factor at work and that was the phasing out of single hull tankers and the adoption of double hulls. This required a massive fleet renewal and contributed to this hefty orderbook as owners were expected to scrap older vessels in favor of these newer and safer tankers. IMO mandates, set for 2019 and 2020 have been called the biggest thing, since the double hull requirement, but we’ll get to that in a bit. However, these mandates might help explain the current thick orderbook as owners anticipate scrapping older tonnage at a much greater pace.
Deliveries dropped off in 2013 and remained subdued through 2015 which paved the way for another bullish run in charter rates, briefly hitting the $100k mark in late 2015. But greed struck again and soon orders placed during this improving environment began hitting the water in 2016 leading to another oversupply problem and a now two-year market downturn.
The point here is that supply side cycles have lately been the main contributor to the boom and bust nature of the crude tanker trade.
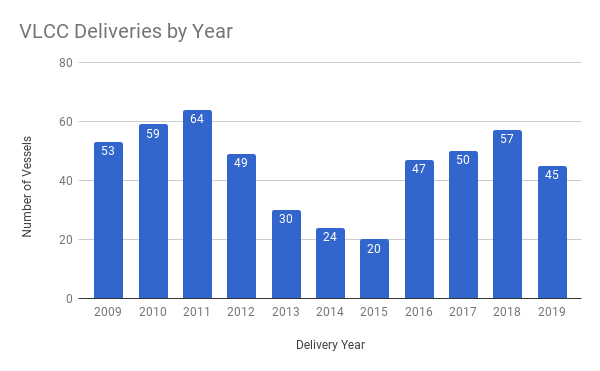
Now, let’s take a look at that same chart but add in expected deliveries for 2018 and 2019.
Source: Data Courtesy of VesselsValue, Chart by James Catlin
While the numbers may be slightly smaller than the delivery cycle between 2009 and 2012, and the demand for crude tankers has grown slightly, the pattern is impossible to ignore.
What also stands out is, that 2018 is projected to be the busiest delivery year in this current cycle.
Once again if history is a guide this influx of deliveries could create a bit of a hangover that might last several years.
Source: VesselsValue
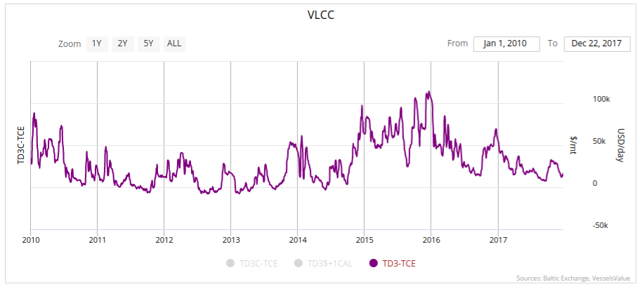
TD3 represents the Middle East Gulf to Japan voyage, which is considered a benchmark route for the VLCC trade.
While deliveries slowed after 2012, the impact of this tonnage hitting the water was felt for a quite a while, years in fact. Notice that toward the back half of 2011 rates had already fallen to severely depressed levels and a correction of any sort of meaningful duration didn’t begin until the back half of 2014.
2019 is set to bring an end to this current hefty delivery schedule with 2020 and 2021 clearing up, with only seven and two deliveries, respectively.
But the damage may already be done. However, there are two potential bright spots on the horizon which could help bring the market back into equilibrium more quickly. We’ll get to those in a bit. But first let’s discuss another reason for the horrible market in 2017 as well as the first month of 2018, which saw rates plummet to depressing levels.
Ton Mile Demand
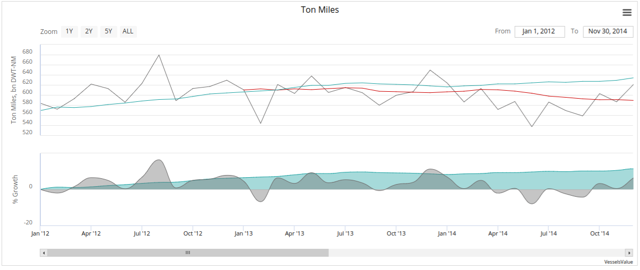
Another problem plaguing the market from 2012-2014 during that previous low rate period was a lack of ton mile demand growth. In fact, ton mile demand growth remained fairly flat through those years.
Source: VesselsValue
Over the period shown above, January 1, 2012 to November 30, 2014 the active fleet had grown by 10.5%. However, ton mile demand growth over that time came in at just 0.5%.
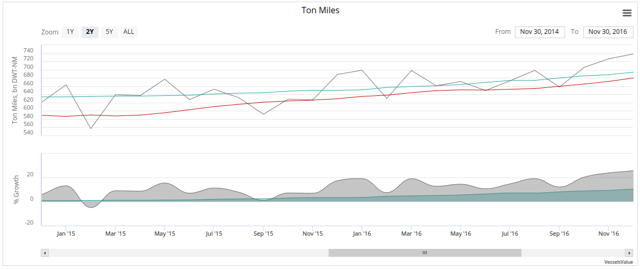
But 2015 through the end of 2016 witnessed some impressive gains in ton mile demand growth which added to the bull run in 2015 and masked some of 2016’s weakness.
Source: VesselsValue
Over this period the fleet had grown by 9.3%, however, ton mile demand growth came in at a whopping 23.9%.
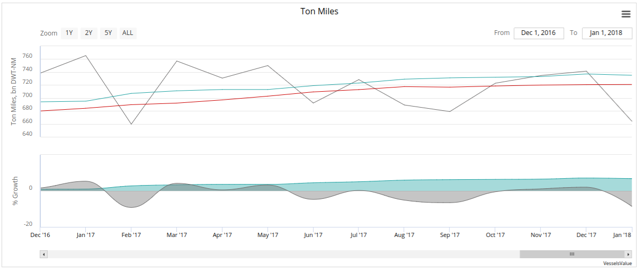
But January 2017 saw a peak in ton mile demand and throughout 2017 and now into 2018 we have actually witnessed a decline.
Source: VesselsValue
Over this period we actually saw the fleet grow by 5.9% but ton mile demand failed to grow, in fact it reduced by 10.1%.
Since the economy remains robust this ton mile demand contraction isn’t due to a lack of demand for crude. But instead it can likely be traced to a couple to developments on the supply side.
OPEC And Venezuela
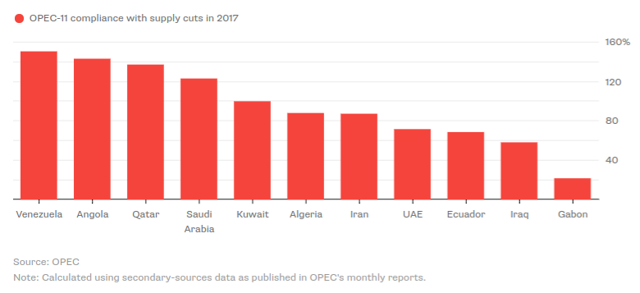
The Declining output from OPEC through a collective and coordinated effort to curtail supply appears to be playing into this ton mile demand contraction. These OPEC driven output cuts have seen a high level of compliance among member nations, and other key producers such as Russia, have joined.
In fact, the word compliance might not be generous enough for some nations like Saudi Arabia which had targeted cuts of 177 million barrels and kept an extra 40 million off in addition. Angola had pledged to cut 28.47 million barrels but figures show they likely cut closer to 40.76 million barrels. Qatar had also exceed predetermined cuts by approximately 4 million barrels.
Source: Bloomberg
But the largest cuts in terms of percentages didn’t come by choice for one nation.
Venezuela represents one of the longest hauls possible for crude to hit the shores of Asia. But Venezuela’s crisis deepened over the course of 2017 as crude oil production fell nearly 13% last year, hitting a 28-year annual low.
Venezuela produced just 2.072 million bpd in 2017, versus 2.373 million bpd the previous year, a nearly 300,000-bpd drop. That was the biggest decline among OPEC members that have pledged to restrain production, since the start of 2017 through 2018.
The outcome was predictable as constrained supply raised prices reducing demand for crude tankers as global inventories, which were at very high levels, saw reductions.
Global Inventory Levels
Significant builds in global inventories created extra demand for crude tankers beyond normal trading patterns as nations took advantage of low prices courtesy of the glut to fill reserves to exceptionally high levels.
But the same way the glut provided the catalyst for inventory builds, the recent supply cuts and higher prices have led to drawdowns. This situation not only took away that extra demand for crude tankers but also reduced demand for those tankers beyond normal trading patterns.
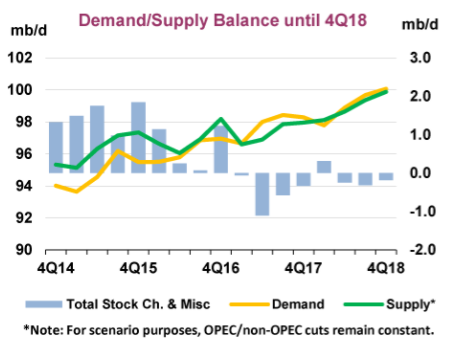
The IEA reports: “In the three consecutive quarters 2Q17-4Q17 OECD crude stocks fell by an average of 630 kb/d; such a threesome has happened rarely in modern history: examples include 1999 (prices doubled), 2009 (prices increased by nearly $20/bbl), and 2013 (prices increased by $6/bbl). Since the nadir for Brent crude in June when the price was $45/bbl, the 2017 OECD crude draws have coincided with a price increase for Brent of nearly $25/bbl.”
Source: IEA
It is noteworthy that this forecast out of the IEA takes into account “rapid US growth and gains in Canada and Brazil.”
With OPEC pledging to continue the supply cuts through 2018 and mounting trouble out of Venezuela, it looks as though a year of drawdowns is on the horizon.
Is There Any Hope?
As noted in many of my previous reports there is a direct correlation between low charter rates and high levels of demolitions. 2018 will likely see some of the worst sustained rates in this latest downturn, just as demolition prices are at the highest levels seen in years providing increased incentive for owners to scrap older tonnage.
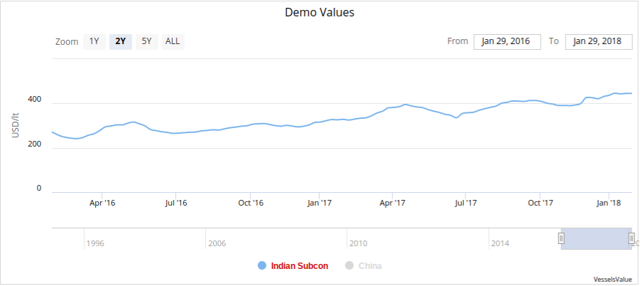
Source: VesselsValue
In addition to that the Ballast Water Management Convention coupled with the 2020 Sulfur Cap requires extensive investment for the former and either extensive investment or use of more expensive bunker fuel for the latter.
This points to potentially increasing demolition activity over the course of 2018 and 2019 which could bring the fleet into balance a bit faster than, would normally be the case.
As noted earlier we saw a phase out of single hull tankers by 2015. But this regulation had been in the works for decades, following the Exxon Valdez disaster allowing for a smooth transition to double hulls with minimal shock to the segment. This could explain the high level of deliveries as well as high demolition rates leading up to this date. So, while there was a vessel influx it was balanced with a high level of demolitions.
But just how much demolition activity can we expect from this current situation?
First, it is noteworthy that VLCCs typically have a shorter lifespan than most smaller crude tankers, about 20 years. VesselsValue shows that anything built in 2000 or later is currently valued no greater than what they would command in the demolition market.
Second, these IMO mandates aren’t calling for the scrapping of older vessels, but just retrofitting them or requiring the use of low sulfur fuel. Therefore, it’s not so much a complete phase out of older tonnage, instead just tonnage that would be considered too old to retrofit or too inefficient to be profitable utilizing the much more expensive sulfur compliant fuel.
Therefore, the consensus seems to be that demolition activity will likely be confined to vessels 15 years or older in the VLCC segment.
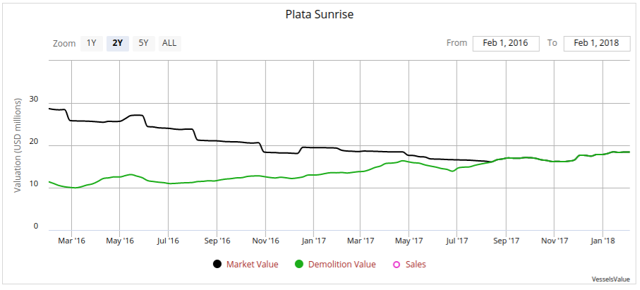
Below is a snapshot of the recently scrapped VLCC, Plata Sunrise, which first hit the water in November of 1999.
Source: VesselsValue
Notice how the increasing demo prices have led to several million dollars of additional scrap value. Also noteworthy is the age of this vessel, which was just barley over 18 years old.
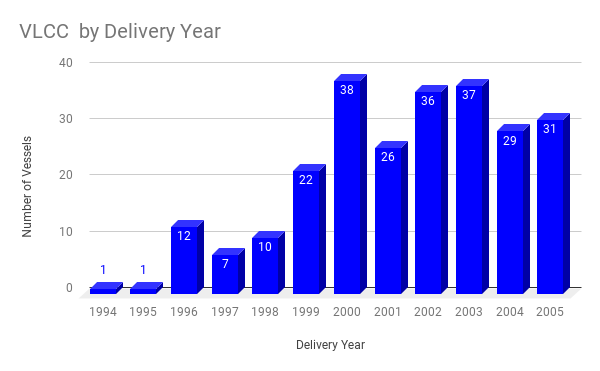
With charter rates in loss making territory and no real improvement in sight over the short run we can expect that many of these vessels built in 2000 or earlier are likely scrapping candidates. But 15 year old vessels are also potential scrapping candidates so let’s throw those in as they are a wildcard of sorts in this equation.
Source: Data Courtesy of VesselsValue, Chart by James Catlin
If vessels built in 1999 and 2000 begin to head off to the scrapyard, as some already have, a significant amount of tonnage begins to come off the water. In total, 91 vessels are potential scrapping candidates. Of course, since we still see tonnage on the water from as far back as 1994 it is clear that not all of these potential candidates will be sent in for demolition. Nevertheless, the low charter rates coupled with upcoming mandates from the IMO make scrapping more likely now than anytime in the past few years.
Conclusion
2018 looks to be shaping up as the worst year in a short while for the VLCC market as a large influx of vessels over previous years has unfavorably altered the supply side, with 2018 marking the peak delivery year for this cycle.
In addition to this heavy delivery schedule we will continue to see inventory drawdowns play a role in curtailing tanker demand. With global stockpiles hitting record highs in some regions just a year ago, this situation could play out quite a bit longer. Ton mile demand might therefore continue to stagnate or even slide.
Venezuela, a long haul route for many trading partners such as China, India, and Japan will further suffer the effects of poor decision making courtesy of a regime that failed to recognize the importance of private and public investment in its oilfields, as it continues to suffer from a domestic political upheaval and unfavorable economic conditions.
The only potential way to alter this bearish outlook would be for scrapping of vessels to accelerate. This isn’t too far out of the question as low charter rates often inspire greater amounts of scrapping. In fact, the degree of market capitulation is typically directly correlated to the level of demolitions. So the worse the market gets in the short run the more readily it might correct over the medium to long run if that correlation holds.
Finally, the IMO mandates are drawing closer and vessel owners will have to make a decision to invest further capital in their aging ships or send them to the scrapyard during the most promising demolition market seen since the first half of 2015.
Going forward, the pace of deliveries coupled with the level of scrapping becomes an important mix in determining, instead how fast this market can return to equilibrium.
Did you subscribe for our daily newsletter?
It’s Free! Click here to Subscribe!
Source: Seeking Alpha


