
The more-than 1.2 million km of fibre-optic cables that criss-cross the planet carry the world’s phone calls, internet signals and data. But this summer, researchers published the eerie sounds of blue and fin whales detected by a fibre-optic cable on the west coast of Svalbard — a first.
Now the researchers want to eavesdrop on an even larger beast — the Earth itself.
Fibre-optic network
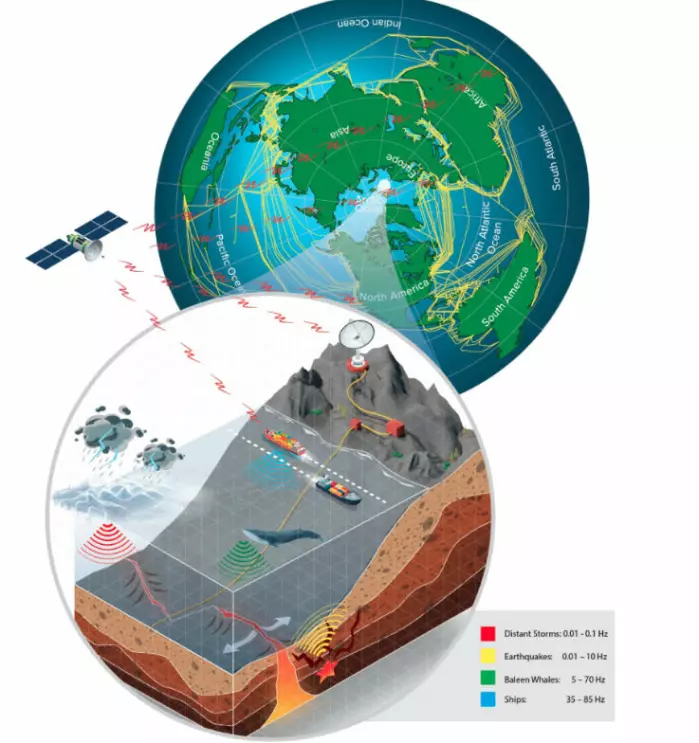
Combining the world’s fibre-optic network with existing remote-sensing systems, like satellites, could create a low-cost global real-time monitoring network, Martin Landrø says.
He is a professor at NTNU’s Department of Electronic Systems and head of the Centre for Geophysical Forecasting.
“This could be a game-changing global observatory for Ocean-Earth sciences,” he says.
Landrø was lead author for an article about how such a system could work, published in Nature Scientific Reports.
Tiny changes in a fibre the diameter of a hair
Fibre-optic cables are nothing new. They’re probably carrying the information your computer is decoding so you can read this article.
What has changed, however, are the tools that can be used to extract information from these networks. The tool in question has the rather alarming name of an interrogator.
The interrogator can be hooked up to a fibre-optic cable network to send a pulse of light through the cable. Any time a sound wave or an actual wave hits the underwater cable, the fibre flexes, just a little bit.
“And we can measure the relative stretch of the fibre extremely precisely,” Landrø says. “It has been around for a long time, this technology. But it has made a huge step forward in the last past five years. So now we are able to use this to monitor and measure acoustic signals over distances up to 100 to 200 kilometres. So that’s the new thing.”
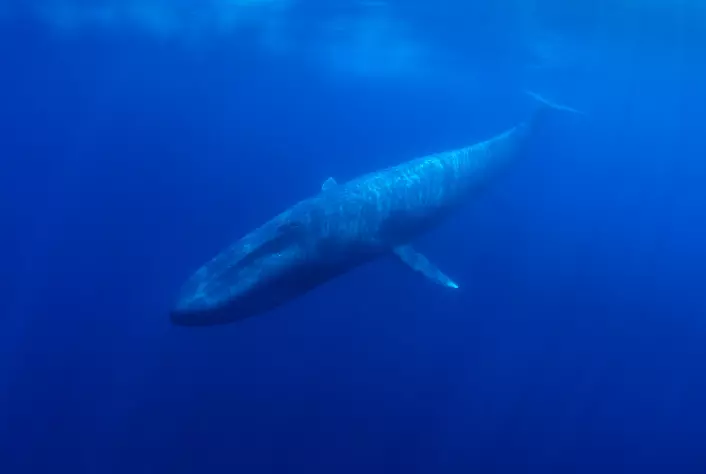
Landrø’s team used a 120 km long fibre-optic cable between Longyearbyen, the largest settlement in Svalbard, and Ny-Ålesund, a research outpost on the southwest coast of the largest island in the archipelago. They monitored the cable for 44 days in 2020, and tallied up more than 800 whale vocalisations. You can read about those results here.
“The fibre cable between Longyearbyen and Ny-Ålesund, which was put in production in 2015 after 5 years of planning and prework, and mainly funded by our ministry, was intended to serve the research community and the geodetic station in Ny Ålesund with high and resilient communication capacity,” Olaf Schjelderup, head of Sikt’s national R&E network, said in an earlier article about the monitoring project. Schjelderup was also a co-author on the new paper.
“The DAS sensing and whale observation experiment shows a completely new use of this kind of fibre optic infrastructure, resulting in excellent, unique science,” he said.
The technology is good, but range continues to be a limitation. The hope is it will get even better as the technology improves, according to Landrø.
“Although current interrogators are not yet able to sense beyond the repeaters typically used in long fibre-optic cables, the technology is developing very quickly and we expect to be able to overcome these limitations soon,” Landrø says.
Ships, earthquakes, and a strange pattern of waves
In the process of detecting whale calls, the researchers were also able to detect ships passing over or near the cable, a series of earthquakes, and a strange pattern of waves that they eventually realised was due to distant storms.
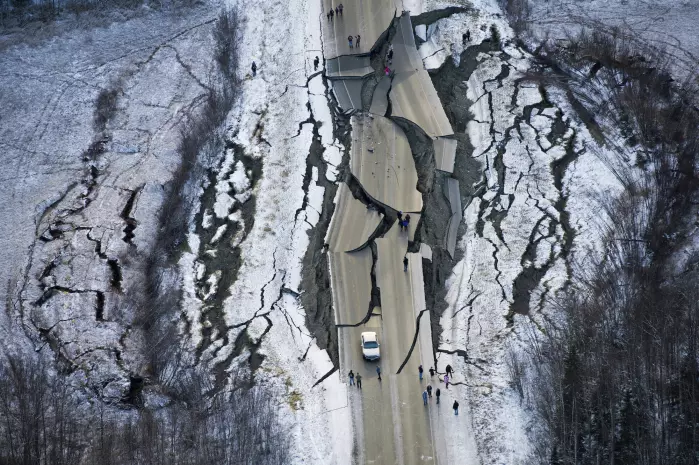
The measurements were precise enough that they could correlate their measurements with each exact event that had happened — including a big earthquake in Alaska, Landrø says.
“We saw a lot of ship traffic, of course, and a lot of earthquakes, the biggest of which was from Alaska,” he says. “That was a big one — we saw it on every channel (in the cable) for all 120 km. And we also saw that we could detect distant storms.”
One example of how the system was able to detect ships involved the Norbjørn, a general cargo ship that was detected crossing the fibre-optic cable about 86.5 km from Longyearbyen. The researchers were able to estimate the ship’s speed from its track across the cable, and then could verify it with the ship’s Automatic Identification System (AIS) track.
A key publication from 1963
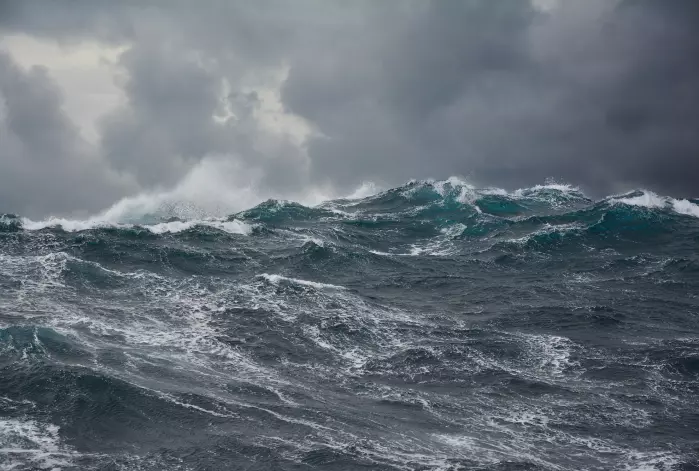
Researchers were initially puzzled by the dozen series of waves they detected during the monitoring period. Each wave event lasted between 50-100 hours, where the frequency of the waves increased monotonically during the event. But eventually they realised that the mystery signals were the swells sent by distant storms.
“These are the physical ocean waves that travel on the sea surface,” Landrø says.
The lowest frequency waves travel the fastest, followed by higher frequency waves that arrive as much as 6 days later. It’s a pattern that was recognised in 1963, when the oceanographer Walter Munk published a paper describing how scientists could figure out where the waves generated by storms were coming from, by measuring the slope of the frequency-time plot of the waves and doing some calculations.
Using these calculations, Landrø’s team identified Tropical Storm Eduardo, which was 4,100 km from Svalbard in the Gulf of Mexico. They also identified a big storm off of Brazil, 13,000 km away from the Svalbard cable.
More information on earthquakes
Geologists already have a network of sensors that help them monitor and measure earthquakes, called seismometers. These instruments are sensitive and provide a great deal of detailed information, according to Landrø.
However, seismometers are expensive, and they aren’t nearly as widely distributed as the world’s fibre optic cable network.
The one drawback with the fibre optic network is that it has a lower signal-to-noise ratio. That means there’s a lot of background noise, and the signal — from the earthquake — isn’t as clear or strong against the background noise.
But the advantage of the fibre network is that it is widespread, and already in place, which means it could provide additional information to existing seismometers. The idea wouldn’t be to replace the existing system, but to complement it.
“The question then is, what can we learn from a method that has lower signal-to-noise ratio, but has better spatial coverage? How could we use that extra information, even though it is lower quality, to learn more about the earthquake and its properties?” Landrø asks.
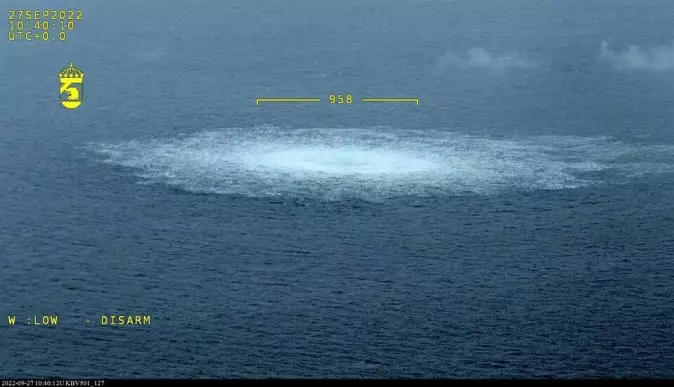
(Photo: Swedish Coast Guard)
Monitoring pipelines for potential sabotage
There’s also the question as to whether existing fibre optic networks could be used to monitor undersea pipelines — which is especially important given the explosion in late September that damaged the Nord Stream 1 and 2 pipelines.
“Can we use this fibre optic technology to monitor and protect infrastructure on the seabed? That’s an important question,” Landrø says.
The challenge with pipelines is that they make noise, as gas flows through the pipe.
“With the background noise, we have to characterise the natural variability. And then if you have something coming close to that pipeline, what is the threshold? When do you act, what can you detect? And we don’t know,” he says. “So the plan is to conduct dedicated tests on this.”
Eventually, the idea could be to have real-time monitoring of pipelines to make sure they are safe. Already, researchers have a real-time stream of acoustic data from the Svalbard fibre network.
You can see a short video of a fin whale that cruised by the cable below. The ‘image’ appears and then disappears at the bottom of the video towards the middle, and is actually a record of the frequency of the whale’s vocalisation, at 20 Hz. This is a typical frequency for fin whale vocalisations, which is how the researchers can identify it.
Did you subscribe to our daily Newsletter?
It’s Free! Click here to Subscribe
Source: Science Norway


