- The existing three-alliance structure in the shipping industry is set to change in February 2025.
- The current alliances have significantly influenced capacity market share on key trade routes like Asia-North America West Coast and Asia-North Europe.
- The upcoming changes in the alliance structure will likely reshape the competitive landscape and impact shipping rates and service offerings.
Sea-Intelligence analyzes the share of the three largest shipping alliances in 2017-2024.
Alliance capacity market share
The current three-alliance structure has been in place since April 2017, when Ocean Alliance and THE Alliance launched operationally, alongside the already existing 2M alliance. After nearly 8 years of operations, February 2025 will bring about a new alliance structure, according to Sea-Intelligence.
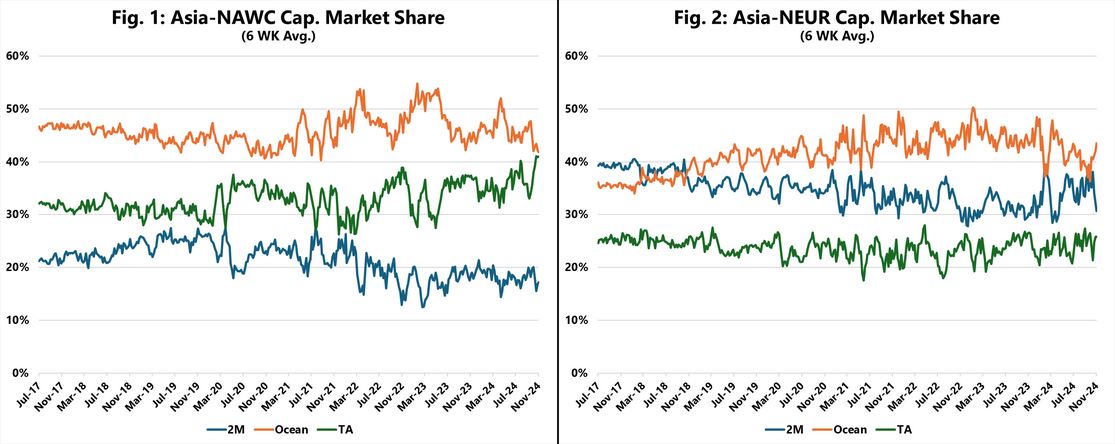
Capacity market share is an interesting metric to see the extent of the presence of a carrier alliance in any given trade. Figures 1 and 2 show this for the existing three alliances throughout their life cycle so far for Asia-North America West Coast and Asia-North Europe.
 These figures are in isolation and only show the capacity market share within the alliances.
On Asia-NAWC, Ocean Alliance has by far been the most dominant carrier alliance in terms of deployed capacity, with 2M on the other end. Furthermore, throughout the life cycle of the existing structure, there has hardly been any movement indicating a change in market dynamics.
THE Alliance has in recent months captured more capacity market share and is closing in on Ocean Alliance. On Asia-NEUR, Ocean Alliance overtook 2M by the end of 2018 as they increased their capacity market share. Since then, Ocean Alliance has maintained the highest capacity market share, with 2M close by.
THE Alliance on the other hand, has a clearly different market strategy, maintaining the lowest capacity market share throughout.
Did you subscribe to our daily Newsletter?
It’s Free Click here to Subscribe!
Source: Sea-Intelligence


