


A Visual Capitalist news source speaks about the Most Carbon-Intensive Sectors in the World.
Ever wonder which sectors contribute the most to CO2 emissions around the world?
In this graphic, we explore the answers to that question by comparing average Scope 1 emission intensities by sector, according to an analysis done by S&P Global Inc.

Defining Scope 1 Emissions
Before diving into the data, it may be useful to understand what Scope 1 emissions entail.
Scope 1 emissions are direct greenhouse gas emissions from sources that are owned or controlled by a company, such as their facilities and vehicles.
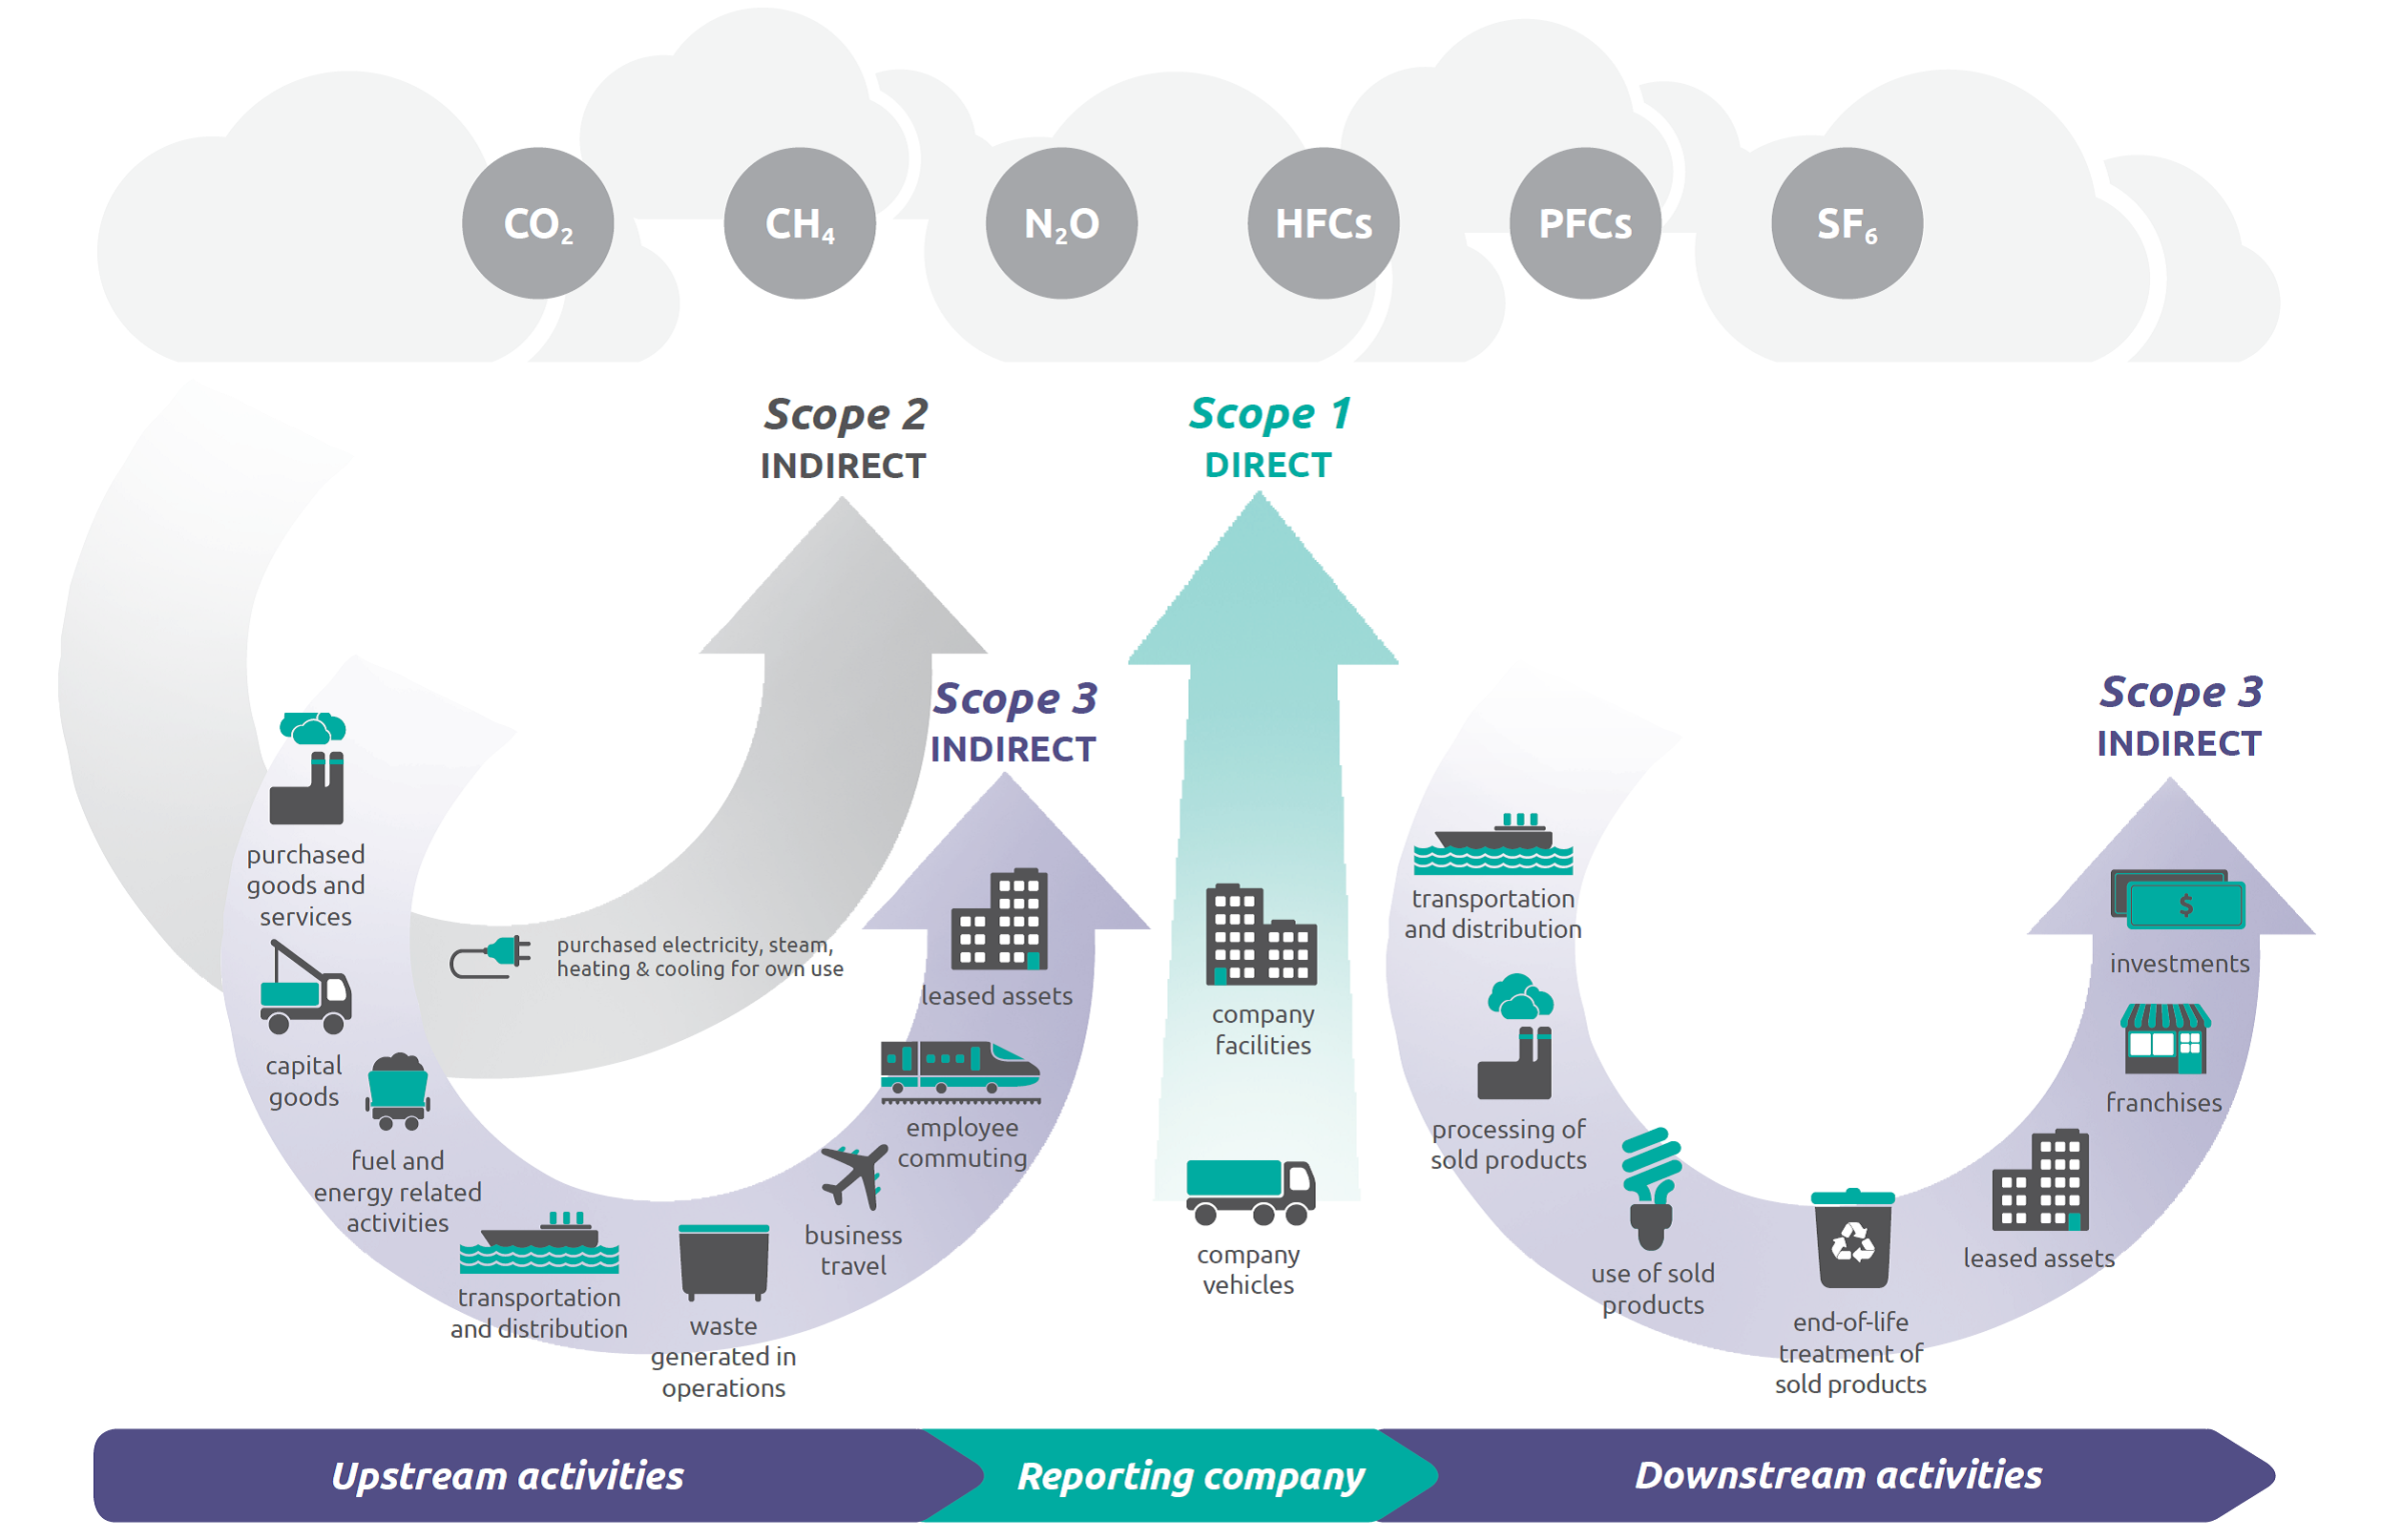
Scope 1 emissions can do a good job of highlighting a company’s environmental footprint because they represent the direct emissions related to manufacturing or creating a company’s products, whether they are tangible goods, digital software, or services.
Scope 2 and 3 emissions, on the other hand, encompass the indirect emissions associated with a company’s activities, including those from a company’s purchased electricity, leased assets, or investments.
Ranking the Carbon Giants
According to S&P Global’s analysis of 2019-2020 average emissions intensity by sector, utilities is the most carbon-intensive sector in the world, emitting a staggering 2,634 tonnes of CO2 per $1 million of revenue.
Materials and energy sectors follow behind, with 918 tonnes and 571 tonnes of CO2 emitted, respectively.
| Sector | Sector Explanation | Scope 1 CO2 emissions per $1M of revenue, 2019-2020 |
|---|---|---|
| Utilities | Electric, gas, and water utilities and independent producers | 2,634 tonnes |
| Materials | Chemicals, construction materials, packaging, metals, and mining | 918 tonnes |
| Energy | Oil and gas exploration/production and energy equipment | 571 tonnes |
| Industrials | Capital goods, commercial services, and transportation | 194 tonnes |
| Consumer staples | Food, household goods, and personal products | 90 tonnes |
| Consumer discretionary | Automobiles, consumer durables, apparel, and retailing | 33 tonnes |
| Real estate | Real estate and real estate management | 31 tonnes |
| Information technology | Software, technology hardware, and semiconductors | 24 tonnes |
| Financials | Banks, insurance, and diversified financials | 19 tonnes |
| Communication services | Telecommunication, media, and entertainment | 9 tonnes |
| Health care | Health care equipment, pharmaceuticals, biotechnology, and life sciences | 7 tonnes |
S&P Global also reveals some interesting insights when it comes to various industries within the materials sector, including:
- Cement manufacturing exhibits an extremely high level of Scope 1 emissions, emitting more than double the emissions from the utilities sector (5,415 tonnes of CO2 per $1M of revenue)
- Aluminum and steel production are also quite emission-intensive, emitting 1,421 and 1,390 tonnes respectively in 2019-2020
- Relatively lower-emission materials such as gold, glass, metals and paper products bring down the average emissions of the materials sector
Given these trends, a closer look at emission-intensive industries and sectors is necessary for our urgent need to decarbonize the global economy.
Did you subscribe to our daily Newsletter?
It’s Free! Click here to Subscribe
Source: Visual Capitalist


