


US fuel oil stocks have been drawn to their lowest level since September 2022 as supply, or implied demand, has surged to their highest in five months, data from the Energy Information Administration (EIA) shows.
Monthly average US fuel oil supply, imports and production since January 2021
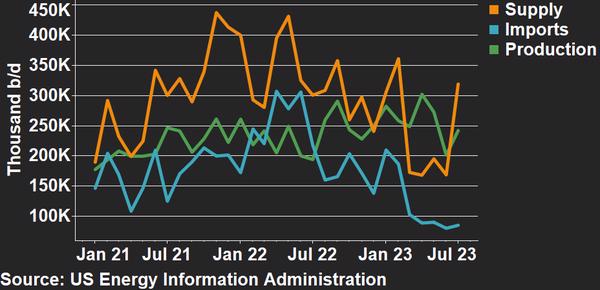
Changes in monthly US residual fuel oil from June to July (so far):
- Supply up 150,000 b/d to 319,000 b/d
- Production up 41,000 b/d to 242,000 b/d
- Imports up 5,000 b/d to 85,000 b/d
Total US fuel oil stocks have declined for eight consecutive weeks, partly due to more fuel oil being supplied out of storage to outlets like bunker fuel blenders and bulk terminals, to refinery coking units for upgrades to other higher-value products, or for power generation.
Supply, or implied demand, has risen to 319,000 b/d so far this month, up from 169,000 b/d in June. Overall US refinery utilisation has risen for six months and averaged 94% in July.
US fuel oil production has increased by 20% this month and averaged 259,000 b/d at the end of last week – the highest weekly level since May. Gulf Coast refineries have produced an average of 82,000 b/d this month, up 25% from June. West Coast and East Coast refineries have produced 38% and 21% more fuel oil, respectively.
Monthly average regional fuel oil stocks in the US since January 2021
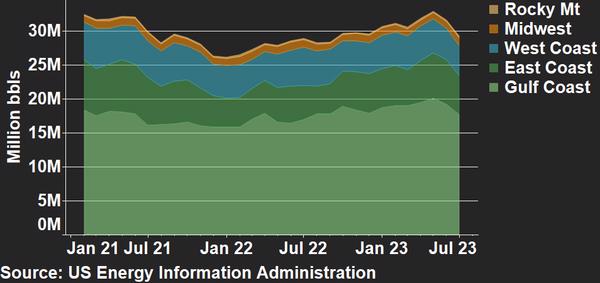
Changes in monthly average US residual fuel oil from June to July (so far):
- Total US stocks down 2.36 million bbls to 29.26 million bbls
- Gulf Coast stocks down 1.5 million bbls to 17.66 million bbls
- East Coast stocks down 782,000 bbls to 5.76 million bbls
- West Coast stocks down 248,000 bbls to 4.47 million bbls
US fuel oil imports have increased by 7% on the month, from 80,000 b/d in June to 85,000 b/d so far in July. According to cargo tracker Vortexa, most of these imports have arrived on the Gulf Coast (75%), followed by the East Coast (19%) and the West Coast (5%).
Mexico has contributed to 36% of total US fuel oil imports so far in July and remains its top source, a position it has held for more than a year.
The Bahamas continues to be in second position, making up about 12% of US imports so far in July. Iraq (10%) has moved into third place, overtaking Algeria (8%).
The EIA’s fuel oil export figures lag two months behind figures for imports and other data. Going by Vortexa data, US fuel oil exports have nearly doubled, from 103,000 b/d from June to 200,000 b/d in July so far.
Singapore (24%) has become the top importer of US fuel oil in July, while the Caribbean Netherlands (20%) has followed in second. Panama (19%) is placed third, followed by India and the Netherlands which have taken about 9% each of US fuel oil exports so far this month.
Did you subscribe to our daily Newsletter?
It’s Free! Click here to Subscribe!
Source: ENGINE


