


According to an article published in Seeking Alpha, the story since the Great Recession has been one of oversupply and historically bad rates for virtually all shipping segments at one time or another.
Brief respites
Brief respites were quickly crushed by over-aggressive owners ordering newbuilds (which were at fire-sale prices due to a massive glut in shipyard capacity) at the first sign of any bullish sentiment, or even at the mere forecast of changing winds.
Investors saw yields dry up, share prices plummet, and massive share dilution in more than a few instances. It was a horrible time. But it wasn’t a surprise to those following my macro outlooks.
Clarity
Due to the lengthy nature of the shipbuilding process, orderbooks (a term referring to vessels on order or being built) often provide clarity years into the future.
Shipping is thousands of years old with historic data detailing the cyclical nature of the industry through the centuries. It’s no surprise that data points to supply-side shifts being the main contributors to the boom-and-bust nature of shipping.
Yes, rare demand-side booms can come along and dwarf supply-side developments at the time, like the unsustainable nature of the demand boom leading up to the Great Recession.
However, due to the reactionary nature of the shipping industry, that causes a collective supply-side response, one that aligns all segments with an influx of newbuilds, destined to result in an oversupply once that demand-side bubble bursts.
This is a key point as it explains to a large degree why all shipping has dealt with an oversupply issue over the past decade. But it also explains why the cyclical nature of shipping is leading to a nearly collective bullish shift – though some more than others.
Bull Market
Over the past year, they tried to highlight the shifting balance of several segments, specifically LNG, LPG, and crude tankers in public reports on Seeking Alpha.
Here are some very simple charts showing key data illustrating how this projected re-balancing has played out.
- Shipping is highly competitive and global in nature (much like a commodity), meaning ship owners are essential “price-takers.” Price, which in the case of shipping is represented by charter rates, is a function of supply and demand. These charter rates compose the operating revenue of a company.
- Supply and demand are composed of vessels on the water and cargo miles traveled, respectively. When fleet growth outpaces demand growth, we see charter rates decline. When the market is tightening (demand outpacing supply) charter rates rise.
- This rudimentary understanding is all you need to comprehend why a structural shift is underway in shipping that, with each passing month, continues to gain momentum.
- Here we will examine specific classes of ships. Looking at current demand-side trends coupled with recent live-fleet growth and future supply-side expectations. The goal is to show a fundamental shift has taken place and will continue to support further market improvements.
- Three segments will be reviewed, crude, LNG, and LPG, with a focus on the largest vessel class in each. Those bigger vessels tend to reflect global collective trend changes better than their smaller counterparts. However, they also experience the most volatility when it comes to short-term shocks, so we will also look to separate short-term noise from long-term trends.
Companies
- Companies engaged in the crude tanker segment include Diamond S Shipping, DHT Holdings, International Seaways, Nordic American Tankers, Euronav NV, Frontline Ltd., Ship Finance International, Teekay Tankers Ltd., Tsakos Energy Navigation Limited, and Navios Maritime Acquisition Corporation.
- Companies that engage in LNG transport include but are not limited to, Dynagas LNG Partners LP, Golar LNG Limited USA, Golar LNG Partners LP, GasLog Ltd., GasLog Partners LP, Tsakos Energy Navigation Ltd, and Teekay LNG Partners L.P.
- Companies engaged in the LPG shipping sector include, but are not limited to, Avance Gas, StealthGas, Navigator, BW LPG, and Dorian LPG.
- The Invesco Shipping ETF offers exposure to several segments but its weighted structure should preclude it for consideration as a proxy regarding the overall shipping market.
VLCC
The Very Large Crude Carrier order book has been a major concern for several years now. But those concerns are waning as this vessel glut is being absorbed and recent orders have been very subdued.
Let’s look at a couple of different charts to get an idea of how the market has been trending and where the supply side will be taking us in the future.
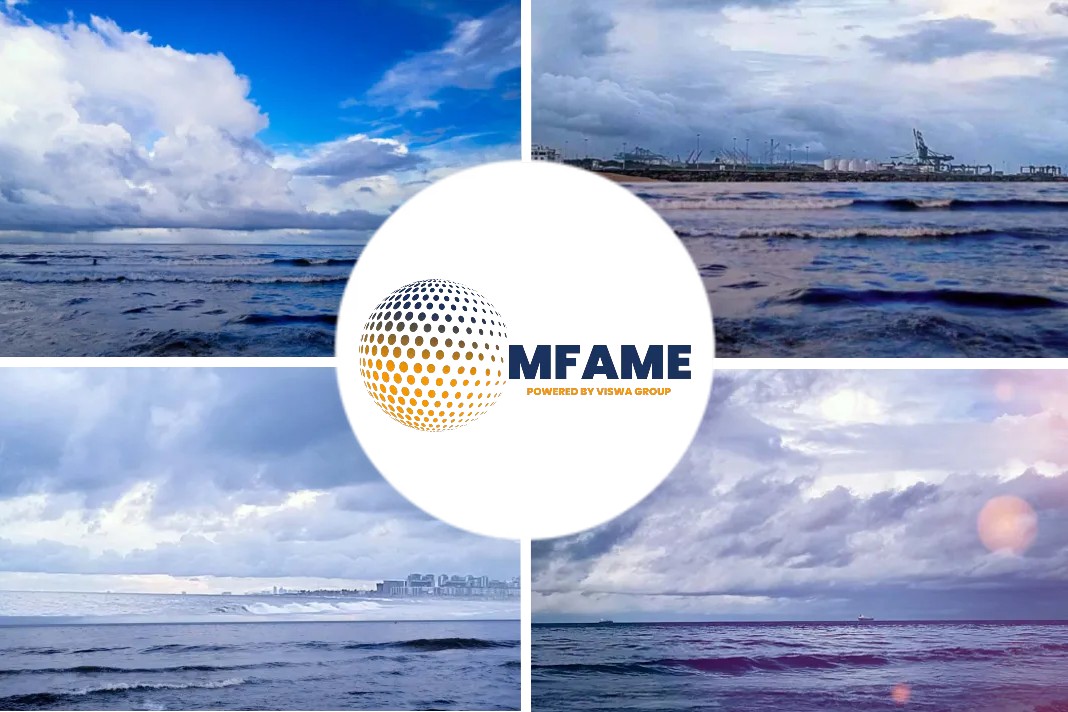
First, the supply-side outlook which shows recent deliveries and expected new vessels.
 Source: Data Courtesy of VesselsValue – Chart by Value Investor’s Edge
Notice that this year has already seen the greatest number of deliveries since 2011.
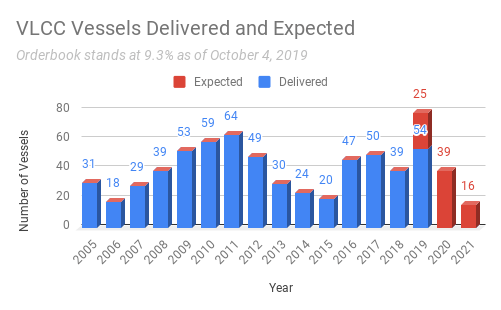
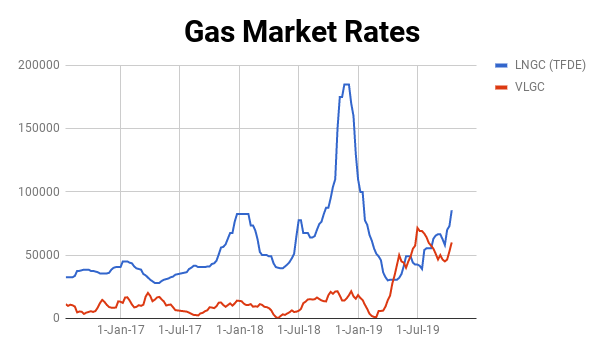
But even with this high level of deliveries and multiple downward revisions regarding expectations for crude consumption, VLCC rates are actually trending upwards.
 Source: VesselsValue
Yes, short-term market disruptions have played a role in the latest spike; however, look at the year-over-year improvement in the two-year chart above. This comes amid a heavier than usual spring refinery maintenance season (lowering crude demand) as preparations are underway for the 2020 Sulfur Cap.
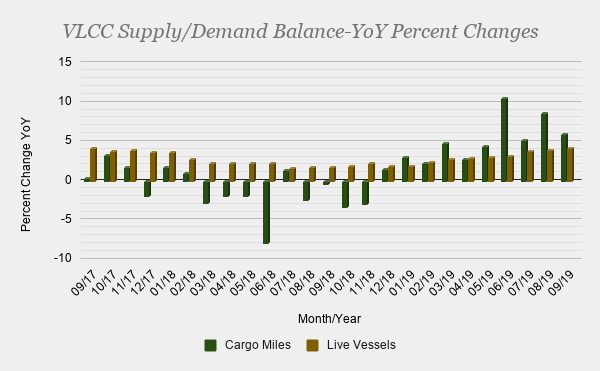
This improvement was projected last summer when we proclaimed a bottom in both the crude and product tanker market. So how do we separate short-term noise from long-term structural fundamentals? Here is where we look at the market balance between live-fleet growth and cargo mile demand.
Live-fleet growth is measured in terms of net vessel additions (newbuilds – retirements). Cargo mile demand is the most accurate way to present demand for vessels as it takes into account distance traveled.
Remember, the downturn in the crude tanker market can largely be attributed to live-fleet growth outpacing demand, creating a supply-side shift leading to lower rates. Recent OPEC cuts coupled with crude stockpile draw-downs amid higher prices played a negative role on the demand side temporarily in 2018, but the effects of those have largely run their course.

Source: Data Courtesy of VesselsValue – Chart by Value Investor’s Edge
Notice the consistent cargo mile demand increases as of late are outpacing the recent supply influx. Turning back to our first VLCC chart, notice that supply additions are set to taper off as we will see just 80 vessels delivered into the fleet through 2021. This is significantly lower in both numbers and the pace of additions than the 93 delivered since the start of 2018.
Those cargo mile increases are set to continue as more US crude is being sourced overseas as the takeaway capacity and export constraints are resolved. Remember, these gains come as multiple downward revisions for global crude demand volumes have hit the market. Volume growth may indeed be suffering but the trade flow shift has provided ample cargo mile demand growth to allow the market to tighten.
For the first half of 2019, the top destinations for US crude cargoes were East Asia and Oceania, representing some of the longest hauls possible. In short, this shows that the market balance is favoring higher rates as we move forward and expectations are for this trend to continue.
LNG
The re-balancing effort in the LNG shipping segment has been underway for quite some time now. Some might recall a 2016 report where I cited the back half of 2018 as a potential recovery timeline. Well, in late 2018 spot rates soared, approaching $200,000/day.
This was in response to high demand but also a stockpiling effort to ensure against shortages, which were experienced in 2017. However, a warm autumn/winter in 2018/2019 and ample stockpiles worked against the LNG segment temporarily.
Again, the point is that it is crucial to differentiate between short-term demand shifts (in this case the unpredictability of weather) and long-term structural balancing acts.
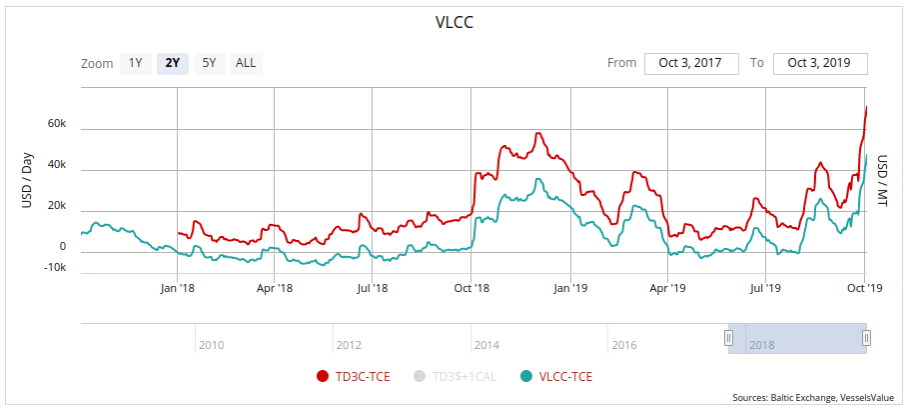
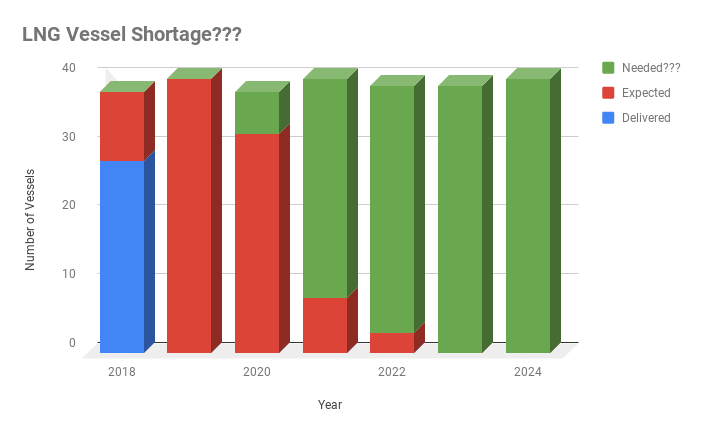
First, let’s take a look at the current order book.
 Source: Data Courtesy of VesselsValue – Chart by Value Investor’s Edge
A bit of context is needed for this chart. Anyone looking at it would be able to see a higher level of deliveries than the 2014-2016 years, which were actually credited for most of the recent market downturn.
So what’s changed? In short, the years leading up to 2016 saw approximately 5% CAGR for LNG vessel demand. But the chicken/egg problem was solved through a massive amount of LNG capacity which began to be introduced in 2016 and was readily absorbed by the market.
Much of this new capacity came out of the USA. At first, many thought Europe and Latin America would see the majority of US LNG exports; however, it’s really East Asia that has led the way, introducing a very bullish long haul into the trade route.
Volume adoption has grown significantly, but the cargo mile multiplier has added to overall LNG vessel demand in a profound manner.
 Source: Author
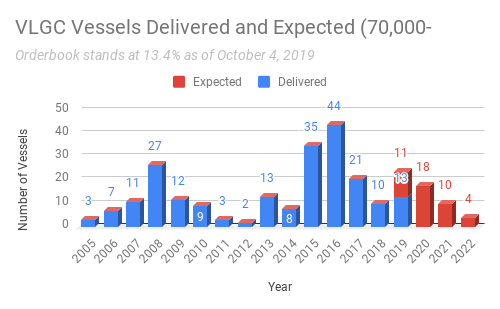
A recent order for an LNG vessel saw the order placed on June 26th with expected delivery for September 2020. This means the window for 2020 is closing.
We did see quite a few orders right after that report which alleviated concerns for a vessel shortage in 2021, which is falling in line perfectly. 2021 deliveries are pretty much set in stone due to the lengthy build times.
The order books in 2022 and 2023 have room to absorb billions of dollars in investment before it becomes a hindrance to the market. In fact, billions are needed right now to ensure a stable supply side for 2022 and beyond.
In short, the upcoming deliveries are welcome and with so few actually available for spot chartering the market will likely remain tight.
In fact, it won’t just remain tight, it’s likely to get tighter if recent trends hold. Below is the supply/demand balance for large LNG carriers.
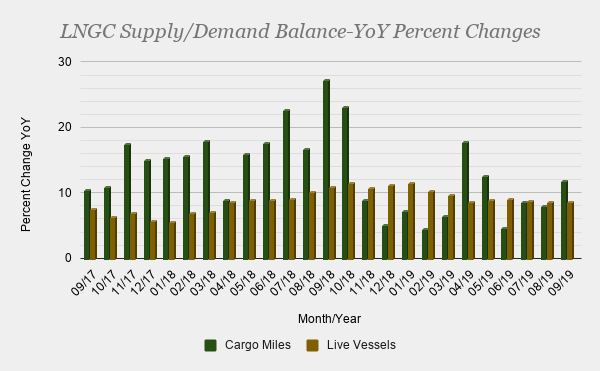
Source: Data Courtesy of VesselsValue – Chart by Value Investor’s Edge
Notice with the exception of the demand-side impact brought on by the previously discussed warmer weather and high stockpiles in East Asia, the long-term trend is clear with cargo mile growth steadily outpacing live-fleet growth.
This is expected to continue as new LNG capacity coming online continues to grow. With 2019 seeing a record year for FID this has ensured an even better long-term outlook for 2023 and beyond.
LPG
The most overlooked and underfollowed segment that I cover could be a legitimate “dark horse” candidate for the best-performing segment through 2020.
In a recent Value Investor’s Edge exclusive report, I detailed how the LPG segment was able to shake off one of the most negative trade flow shifts and demand-side developments in recent times.
Strong organic global growth is underpinning the bullish outlook for this segment in a big way, to the point that LPG spot rates continued to climb in the face of this massive headwind.
The negative story, of course, was the US-China trade war. As China shunned US LPG, substitutes had to be found, straining existing alternate suppliers, and volume growth inevitably suffered as they struggled to replace existing US cargoes. Looking at VLGC cargoes illustrated this point.
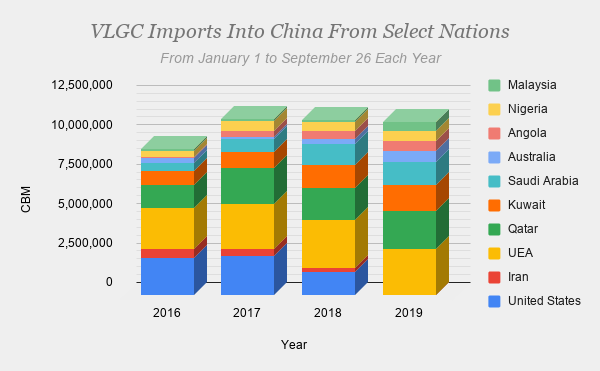
Source: Data Courtesy of VesselsValue – Chart by Value Investor’s Edge
However, cargo mile demand suffered as the volumes they replaced from the long haul US route were sourced from a shorter distance away.
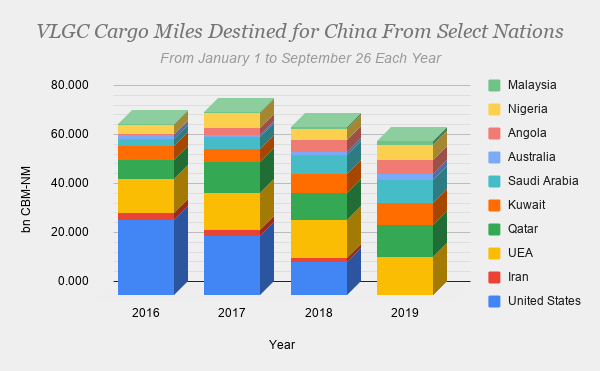
Source: Data Courtesy of VesselsValue – Chart by Value Investor’s Edge
Once again, looking at the latest charts will show just how the market shrugged off this very bearish development, which has now fully run its course and no longer poses a threat.
 Source: ShipBrief
In fact, an argument could be made that a recent arbitrage window (which has shown impressive resilience) has much to do with increased Chinese competition for alternate supplies as the US expands takeaway and export capacity.
So, here’s the catch, no trade deal bodes well for arbitrage, which is great for LPG vessels. A trade deal, noted in the previously mentioned VIE exclusive report, could add as much as 10% to existing cargo mile demand in a very short time which would be an absurdly bullish development. Either way, LPG vessels are seeing a benefit.
The long term story here is that growing supply out of the US will dominate the LPG story over the next few years, with the main demand epicenter being East Asia and India, representing very long hauls.
So let’s finally turn to the supply outlook and then the market balance.
 Source: Data Courtesy of VesselsValue – Chart by Value Investor’s Edge
2019 was the heaviest year in a while, with an approximate 7.5% in gross fleet growth. 2020 will taper off 5.6% and 2021, which is almost set in stone due to the lengthy nature of the build times, is looking downright scarce.
 Source: Data Courtesy of VesselsValue – Chart by Value Investor’s Edge
The above chart should make it clear how the negative developments impacted cargo mile demand and how it has finally run its course. The market is now being dictated by strong organic demand in other regions supported by ample US cargoes which are (on average) creating a greater cargo multiplier than other origins.
Conclusion
The inherent cyclicality of the industry (market responses with direct correlative long-term effects of similar magnitude) continues to ensure a bullish forward outlook.
This means the unprecedented market capitulation since the Great Recession was met with a reactionary response from investors, owners, banks, creditors, sell-side brokers, private equity, and others. The response was to pull back in a similar magnitude and risk appetite dried up.
One important outcome is that the order book went from one of the largest ever on record to the smallest in over two decades, and even longer for some segments. This massive supply-side adjustment, favoring a tighter market, isn’t something that will be or can be, corrected in the near future.
Furthermore, this thinning order book is being met with major cargo mile gains courtesy of US exports in crude, LNG, and LPG, which continue to see East Asia as the main export market, creating a bullish long haul multiplier.
Did you subscribe to our daily newsletter?
It’s Free! Click here to Subscribe!
Source: SeekingAlpha


