


- After enjoying a phenomenal run in 2019, shipping stock trading ranges have collapsed and our portfolios have been bloodied.
- The Coronavirus continues to ravage the markets. Just as we were getting positive momentum out of China- new virus pockets have emerged across the world. USA next?
- A mixture of quarantine measures and consumer panic have caused near-term shipping activity with China to plummet, only recently picking back up.
- Shipping stocks have continued to fall even as rates have stabilized and strong earnings are rolling in.
- The following report provides a list of 12 top picks in the sector along with relevant risk ratings.
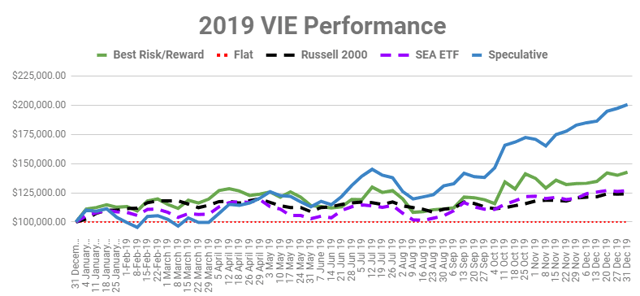
I have been covering the maritime shipping industry and related stocks closely since 2010. I ramped up research efforts on Value Investor’s Edge starting in mid-2015 and we’ve emerged as the preeminent source of shipping equity research. Shipping is a notoriously volatile sector, but we had a good run overall and 2019 was a phenomenal year; however 2020 has been a disaster for shipping investors to-date. After returning an average of 72% between our two model portfolios during 2019 (+43% & +101%), we’re down an average of 27% YTD (-22% & -32%), writes J Mintzmyer in an article published in Seeking Alpha.
Here’s an excerpt from his article.
Shipping Market Panic: Record-Level Selloff
This is the worst nominal 2-month performance slide we’ve had since Nov/Dec 2018, and relatively speaking (i.e. vs. the Russell 2000), this is the worst selloff I’ve seen in the shipping markets since the collapse of the 2008-bubble, perhaps even worse than 2008 for some stocks.
Is this indeed the worst shipping equity sell-off in modern history? I don’t have the full equity price back-testing to prove it, but we’re darn close. We also lost our primary market comp in mid-Febraury with the complete wind-up and delisting of the Invesco Shipping ETF (SEA). It was a flawed ETF, almost always producing sub-market returns, but the resolution of the sole industry tracker is just further proof of the market giving up on the space.
We’ve enjoyed a great average run at VIE since mid-2015, but there have been moments of difficulty before. The last two major selloffs were December 2015 thru February 2016 and November 2018 thru December 2018. For the former, the collapse of the energy sector which led to bargain opportunities in several LP and tanker names even as rates remained high. For the latter, it was a rapid broad market correction exacerbated by escalating US-China trade tensions, which led to further pressure on shipping names.
The 2016 Sell-Off & Previous Shopping Lists
In 2016, in response to the energy market panic, I published a public ‘shopping list’ on 14 January 2016, which included a dozen names which seemed significantly oversold. On 17 June 2016, I updated the list with a fresh set of a dozen names. In just 5 months, our first basket had returned 23%, and we actually had peaked sooner with a 40% return in the first 3 months. Our second basket from mid-2016 also performed well on average, but was closer to the market average.
2016 ultimately was our 3rd best year on record. 2017 was slightly better and then 2019 ended up as our best year by far with an average model portfolio return of +72% as mentioned above.
The 2018 Sell-Off & Model Portfolios
As reviewed, 2016 was choppy, but quite profitable overall; 2017 was a much smoother year across the board. The first 8-9 months of 2018 were bad for ‘banner names’ like Teekay Corp (TK), but we had some very profitable trades including DryShips, International Seaways (INSW), and Seaspan (SSW). The last two months of 2018 were absolutely brutal. We got crushed pretty hard.
I responded with 2 model portfolio selections, which I brought public on 28 December 2018. The ultimate performance of those portfolios was +72% versus the Russell 2000 up 24% during the year.
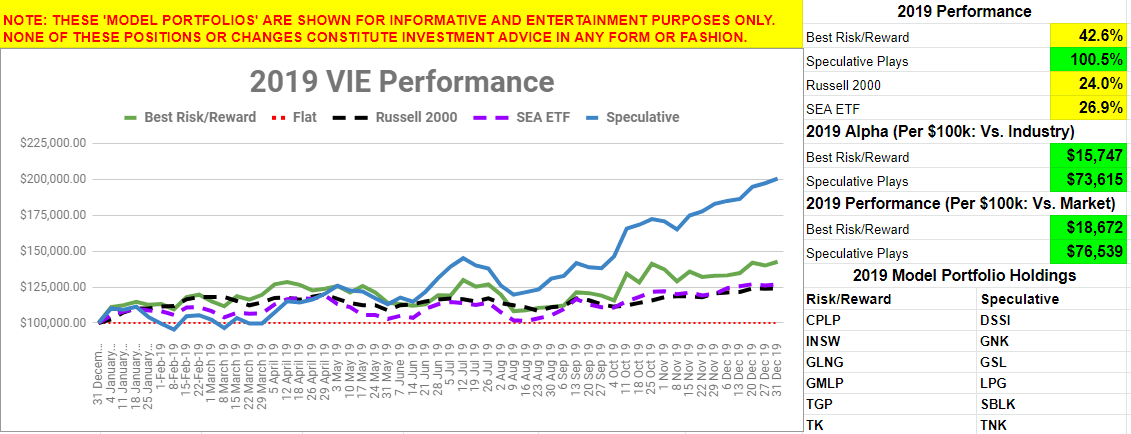
Source: Value Investor’s Edge, Performance Tab, 2019 Models
Q1-20 ‘The Third Selloff:’ Opportunity or Fool’s Errand?
We are now faced with our 3rd major selloff of the past five years. We’ve done very well buying quality firms amidst the panic before, but is it too soon now?
Buying into these situations is never easy. It’s much easier to buy at much higher valuations when things ‘feel’ and ‘look’ better. For instance, Scorpio Tankers (STNG) at $17.63 looks weak, but it looked so nice in the mid-$30s just 2 months ago didn’t it? Euronav (EURN) was a table-pounder in the $12s, but now it doesn’t get a lot of love a few months later at $9.22.
Rules from 2016- Still Valid Today
Although I continue to learn and grow from market experience, I still utilize many core principles when constructing my portfolios. Here are my rules, repeated verbatim, from my report in January 2016. Keep in mind the examples are over four years old now.
- Minimize the exposure to extreme leverage. To draw a parallel to the oil junior speculators who came out of the woodworks in droves last fall, the riskiest players bought stuff like Magnum Hunter and Escalera Resources and are now sitting on 100% losses. Game over. It doesn’t matter if oil hits $250 tomorrow. You’re done, game over. The medium-risk players bought stuff like WPX Energy (NYSE:WPX) and Sanchez Energy (NYSE:SN) are sitting on mega losses, but are still playing. The more conservative speculators opted for more stable firms like Occidental (NYSE:OXY) or Anadarko (NYSE:APC) and haven’t done too poorly, all things considered. That’s a very long analogy, but there are very similar plays available in shipping right now.
- Look for Fixed Contract Revenues. Not all shipping firms are equal. For example, both Gener8 Maritime (NYSE:GNRT) and DHT Holdings (NYSE:DHT) have strong exposure to crude tanker rates. The former is nearly 100% exposed to the whims of the spot market while the latter has decided to lock-in revenues on a large portion of the fleet. Counter-party bankruptcies occur, but they are far less likely to occur than a plunge in spot rates.
- Build a Broad Basket. Even the best minds make huge mistakes; here’s looking at Icahn’s bet on Freeport-McMoran (NYSE:FCX) or George Soros’ insane allocation to Penn Virginia (NYSE:PVA). Building a larger basket of reasonable bets can both help isolate investors from emotional attachment to one name and also allow exposure to a wider array of markets.
- Don’t Chase the “Bargain.” This is the hardest step, but it’s essential for long-term capital appreciation. Set a maximum level of capital to bet and stick to it. If all the holdings plunge, reevaluate the thesis, then reevaluate it again, then call your smartest friends and associates and let them poke holes in your ideas. Nobody ever went broke placing a few risky bets when they limited capital allocation. In fact, lots of investors have made fortunes. Those who get married to an idea and chase a falling star all the way down are destined for the poorhouse. I’ve been guilty of chasing (stupid) ideas, but thankfully I’m young and limited my capital allocation.
- Avoid Margin. What happens if you heavily margin a wonderful idea at $4 and it drops to $3 for a couple days before rocketing to $10+? Your entire portfolio is ruined just because you got greedy. Margin calls are annoying at best and potentially devastating to your entire lifestyle. Be very careful here.
Guidance from December 2018 – Also Valid Today
I was a bit less verbose in 2018, but here’s those listed below. Please review the original article itself for more related commentary:
- Never, ever, (ever!) use margin
- Don’t sell naked puts you aren’t willing to buy
- Only buy firms where you like the underlying assets
- If the price dropping 10% next week would shake you out, move on
- Keep allocations reasonable, all of these are speculative and risky
- Risk/reward seems attractive to me, but major losses are possible
Prepping the Top Picks of March 2020
As mentioned above, this is the worst shipping selloff in modern history, and although the selloff (which in many cases has knocked off 2-3 full years of profits from the share prices) seems to have massively overstated the likely final impact, the vast array of potential 2nd and 3rd-order effects are pretty terrifying. Some of the worst potential outcomes include a China economic collapse, supply chain disruptions, global recession, health system collapses, massive unrest, and government implosions. Add a bit of natural caution to the mix and I don’t blame anyone who prefers to stay back for a bit longer.
Readers should bear in mind that in the most extreme outcomes, there’s not a lot stopping most of these names from potentially becoming zeros. In a more reasonable scenario, I don’t expect any of these companies to suffer that fate; however, there is absolutely no such thing as a ‘floor’ to valuations. One of the names below has a decent balance sheet, conflicted-but-not-nefarious management, and already trades at 25% NAV. Another name below has a solid management, US listing, solid assets, strong cash flows, a good balance sheet and trades under 50% NAV.
Things can get worse. There’s never a floor on these names except the chart trough that we all witness in hindsight. I’ve gotten lucky on my huge pushes early-2016 and late-2018, I’m two-for-two here, but this one could be the exception. I’m allocating to the best names and I generally feel very comfortable in this space, plus I’m fairly young and risk seeking, but even then I’m limiting my allocations to a maximum of 30% of my assets.
If someone theoretically hadn’t invested yet, or was lucky enough to take a lot of profits earlier, then its a much easier and more obvious decision to buy today. It’s much more difficult and requires a lot of soul searching to attempt any sort of ‘doubling down.’
Three Additional Rules/Cautions for March 2020
In today’s market, I strongly suggest (in addition to rules we’ve already reviewed and covered):
- Limit exposure to leverage, and especially to lower liquidity
- Only accept sub-par management if the discount is MASSIVE
- In line with #1: Look at EV/GAV as superior to P/NAV
EV/GAV = Enterprise Value / Gross Asset Value
This compares the net debt + market cap to the value of all assets. This is a different metric than P/NAV
P/NAV = Price (Market Cap) / Net Asset Value (Assets Minus Debt)
This metric is far more sensitive to swings in the valuations of ships. If you’re nervous that ship values could collapse, keep in mind that even a 50% P/NAV ‘bargain bin’ stock with say 80% leverage, could fall to 100% P/NAV with just a 10% drop in asset values. With 80% leverage and a reasonable 20-25% asset drop, the company could be insolvent.
With EV/GAV, you avoid that leveraged conundrum. If you buy a 30% discount to GAV, you’re directly buying those ships 30% off. For instance, check out the snippet from our Live Analytics Platform below, which shows some of the crude tanker plays. At first Tsakos Energy Navigation (TNP) looks super cheap and attractive with a 56% P/NAV, but then look at EV/GAV… 92%… not great!
In fact, the at-first-similar 60% P/NAV at International Seaways (INSW) is wildly superior on risk/reward basis at 73% EV/GAV!
DHT Holdings (DHT) and Navios Maritime Acquisition (NNA) present a similar split. 83% P/NAV, but DHT is superior at 90% EV/GAV to 99% for NNA.

Source: Value Investor’s Edge, Live Analytics Platform, 26 Feb 19
If you believe assets will appreciate, you want to grab the lowest P/NAVs. If you are looking for the best exposure to cash flows, then you want the highest operating leverage (lowest $/DWT, which is market cap per DWT of cargo capacity). If you want the safest stuff, then look for the lowest Leverage (% D/A) and the lower OCF Breakevens.
With all that in mind- here are our top 12 picks. I will cover balance sheet risk (leverage), overall valuations (P/NAV, EV/GAV), market exposure (structure & operating leverage), and most importantly- strength of management.
Our Top 12 Picks – 3 March 2020
The following picks are listed in alphabetical order:
- Capital Product Partners (CPLP) – Long-Term Containerships
- Diamond S (DSSI) – MR Product & Suezmax Crude
- Euronav (EURN) – Crude Tankers (VLCC & Suezmax)
- Flex LNG (FLNG) – Ultra-modern LNG Carriers
- Genco Shipping (GNK) – Diversified Dry Bulk
- International Seaways (INSW) – Crude Tankers (Split)
- Navios Maritime Containers (NMCI) – Panamax Containerships
- Overseas Shipholding Group (OSG) – Jones Act Tankers
- Scorpio Bulkers (SALT) – Midsize & Modern Dry Bulk
- Star Bulk Carriers (SBLK) – Dry Bulk & IMO 2020 Play
- Teekay LNG Partners (TGP) – Long-Term LNG Carriers
- Teekay Tankers (TNK) – Crude Tankers (Suezmax & Aframax)
Capital Product Partners – $10.58 (+13.2% Yield)
This is the only direct ‘income’ name on the list, but with an expected forward coverage of over 2x and a huge discount to NAV, this is primarily a value play and the income is incidental. CPLP is very cheap and attractive overall, but they do have a trio of 9k TEU ships up for re-chartering between mid-2020 and early-2021. They also have heavy exposure to 2nd-tier containership liner Hyundai Merchant Marine (“HMM”).
Value: 45% P/NAV, 71% EV/GAV
Balance Sheet: Strong Liquidity & 47% D/A Ratio
Market Exposure: Heavy Contracts (Watch 9k TEU Re-Charters mid-2020).
Operating Leverage: Very unattractive ($1,986/TEU – Far above peers)
Management Rating: B-, savvy/fair, but huge conflict of interest with GP
Fair Value Estimate: $16.00 (51% Potential Upside)
Diamond S – $10.18
Diamond S is a tanker company split primarily between MR product and Suezmax crude. They have a massive overhang from legacy private equity holders with their final share lock-up expiring 21 March. Suezmax crude tanker rates have held up very well over the past month, but don’t tell the market that… all tankers have fallen similarly. As an additional bonus, these NAV levels are based on Q3-19 results, so DSSI has already earned another 5 months of free cash flow not included here. DSSI will report their earnings this Thursday morning, 5 March.
Value: 53% P/NAV, 76% EV/GAV
Balance Sheet: Strong Liquidity, 50% D/A, Just Completed Refinance to 2024
Market Exposure: Very heavily spot market
Operating Leverage: Strong exposure ($81/DWT)
Management Rating: A-, good corporate governance, but no returns yet
Fair Value Estimate: $21.00 (106% Potential Upside)
Euronav – $9.22
Euronav is a conservative crude tanker company with their fleet split primarily between VLCC and Suezmax vessels. VLCC rates have came down rapidly due to China’s plummeting oil imports, but Suezmaxes are still producing strong rates. EURN has switched to a quarterly dividend and will likely provide two payouts in May- an annual 2019 payment and a Q1-20 payment.
Value: 73% P/NAV, 81% EV/GAV
Balance Sheet: Strong Liquidity, 31% D/A
Market Exposure: Very heavily spot market
Operating Leverage: Moderate market leverage ($106/DWT)
Management Rating: A, good corporate governance & allocations
Fair Value Estimate: $14.00 (52% Potential Upside)
Flex LNG – $6.50
FLNG is a modern LNG carrier pureplay. Despite an attractive positioning in a burgeoning market along with top-tier assets, FLNG’s higher leverage combined with abysmal LNG sentiment has caused the stock to implode. Flex is reported their earnings last Wednesday (26 February). Although they shared a blowout quarter and strong Q1-2020 guidance, the market continued the selloff.
Value: 48% P/NAV, 84% EV/GAV
Balance Sheet: Weaker liquidity & high leverage (68% D/A)
Market Exposure: Heavy spot market & a pair of 1y charters
Operating Leverage: Moderate operating leverage ($27M/Ship)
Management Rating: A-, good corporate governance, unproven allocations
Fair Value Estimate: $14.00 (115% Potential Upside)
Genco Shipping – $7.14 (+9.8% Yield)
Genco Shipping is a diversified dry bulk pureplay with a focused IMO 2020 strategy which involved purely allocating scrubbers to all their Capesize vessels. All installations were concluded by the end of January. Genco reported their earnings last Wednesday afternoon (26 February), nothing too flashy, but they are maintaining their large dividend. They are particularly attractive due to their strong balance sheet and inordinate cash balance.
Value: 66% P/NAV, 80% EV/GAV
Balance Sheet: Very strong liquidity, 42% D/A leverage
Market Exposure: Heavily spot market & short-term voyages
Operating Leverage: Strong exposure ($61/DWT)
Management Rating: B-, decent corporate governance, wasteful allocations
Fair Value Estimate: $12.00 (68% Potential Upside)
International Seaways – $20.59
International Seaways is a diversified tanker company with several modern VLCC vessels along with a motley mix of older vessels. They suffered for years due to a hefty private equity overhang and expensive legacy financing, but they’ve made significant progress during the past six months. They held an extensive investor day on 15 January and they reported their Q4-19 results earlier this morning (3 March). The valuation disconnect is massive even though everything is stable at this company.
Value: 65% P/NAV, 76% EV/GAV
Balance Sheet: Strong Liquidity, 31% D/A, Just Completed Refinancing
Market Exposure: Very heavily spot market
Operating Leverage: Moderate exposure ($106/DWT)
Management Rating: B+, good corporate governance, lack of returns
Fair Value Estimate: $35.00 (70% Potential Upside)
Navios Maritime Containers – $1.14
Navios Containers is the only firm on this list with directly poor management. This is due to heavy conflicts of interest with both Navios Maritime Partners (NYSE:NMM) and Navios Maritime Holdings (NM), the former of which is a massive investor and owns potential dropdowns and the latter of which is struggling to survive and has been leaching all of the Navios Group spare liquidity. The solvency of the balance sheet is fine here, net debt is barely more than demolition values for the fleet; however, liquidity is extremely weak. The valuation disconnect is simply ‘off the charts.’ I’ve never seen 25% P/NAV in a solvent firm before.
Value: 25% P/NAV, 69% EV/GAV
Balance Sheet: Very low liquidity, leverage is fairly high (59% D/A)
Market Exposure: Mostly short-term employment, few ships on long-term
Operating Leverage: Massive market leverage ($259/TEU)
Management Rating: C-, no overt nefarious acts, but major conflicts of interest exist here.
Fair Value Estimate: $4.00 (251% Potential Upside)
Overseas Shipholding Group – $1.89
OSG is a terribly-named firm, they aren’t really ‘overseas’ at all, but rather a Jones Act tanker company with several ancillary niche domestic ventures. They trade massively below their estimated replacement value NAV and at a steep EV/EBITDA discount to their closest peers.
Value: 47% Estimated NAV, Approx. 5x 2020 EV/EBITDA (Peers 9-12x)
Balance Sheet: Mediocre liquidity, Approx 4x Gearing (Debt to EBITDA)
Market Exposure: Mixed exposure, but protected niche markets
Operating Leverage: Moderate exposure to Jones Act rates
Management Rating: B, good corporate governance, weak allocations
Fair Value Estimate: $4.00 (112% Potential Upside)
Scorpio Bulkers – $2.99
Scorpio Bulkers (NYSE:SALT) is a modern and midsized dry bulk pureplay which also still has some hefty indirect exposure to their remaining Scorpio Tankers (STNG) equity investment. They’ve suffered a double-whammy recently due to weak bulker sentiment combined with the collapse (55% in 7 weeks) of STNG. This one receives low governance marks due to related-party fees driving higher G&A costs as well as question capital allocation priorities due to Robert Bugbee and other insiders’ conflicts of interest. I believe the price discount warrants interest down here.
Value: 58% P/NAV, 86% EV/GAV
Balance Sheet: Lower liquidity ex-STNG shares, 71% leverage
Market Exposure: Very heavily spot market
Operating Leverage: Strong exposure ($59/DWT)
Management Rating: C+, weaker corporate governance, conflicts of interest
Fair Value Estimate: $5.00 (67% Potential Upside)
Star Bulk Carriers – $8.51
Star Bulk Carriers is a dry bulk pureplay with the most complete IMO 2020 strategy of all publicly-listed shipping companies. They will have their entire core fleet (114 vessels) retrofitted within the next two months and they are about 90% complete already. SBLK has plummeted along with all other dry bulk companies even though they will be able to earn more than $5k/day higher rates on average. Keep in mind the value discounts below are heavily understated because VesselsValue does not yet track scrubber premiums.
Value: 92% P/NAV, 97% EV/GAV
Balance Sheet: Moderate liquidity, higher leverage (61% D/A)
Market Exposure: Very heavily spot market
Operating Leverage: Strong exposure ($63/DWT)
Management Rating: B+, good corporate governance, questionable capital allocation success thus far
Fair Value Estimate: $12.00 (41% Potential Upside)
Teekay LNG Partners – $12.47 (+8.0% Yield)
TGP is ironically starting to turn into an ‘income’ name due to its share price weakening, but they are primarily a value play focused on long-term LNG shipping contracts. The terrible sector sentiment has caused TGP units to weaken significantly, but keep in mind they have massively outperformed every single one of their industry comps over the past 3, 6, and 12 months. TGP reported outstanding Q4 results last week, but the barely barely moved.
Value: 79% P/NAV, 95% EV/GAV
Balance Sheet: Strong Liquidity, Very high leverage (80% D/A)
Market Exposure: Zero meaningful LNG spot exposure until 2022
Operating Leverage: Heavy operating leverage ($18.5M/Ship)
Management Rating: B+, sold corporate governance, downgrade as a LP with GP/IDR overhang remaining
Fair Value Estimate: $20.00 (60% Potential Upside)
Teekay Tankers – $15.31
Teekay Tankers is a midsize (Suezmax & Aframax) crude tanker pureplay, which was a mega-winner during 2019. Their stock has plummeted over the past couple months even as midsize rates have remained very strong. TNK reported an exceptional Q4-19 result along with strong Q1-20 fixture guidance last Thursday (27 February). The market responded, lifting TNK significantly from about $12 to mid-$16s before falling back a bit this week.
Value: 73% P/NAV, 87% EV/GAV
Balance Sheet: Strong Liquidity, High Leverage (53%), Refinancing Complete
Market Exposure: Heavily spot market
Operating Leverage: Very strong exposure ($68/DWT)
Management Rating: B+, good corporate governance, weak returns
Fair Value Estimate: $25.00 (63% Potential Upside)
Conclusion & Discussion
I look forward to a good discussion on these names and potential other opportunities. No list is perfect and this is certainly not an absolute one. There are lots of other potential contenders, especially if we broaden ourselves into the energy infrastructure space.
Please feel free to join the discussion below and list some of your favorite names as well. I will track the performance of this list and provide updates where relevant.
Record Valuation Opportunity
We provide exclusive deep value research, which is a challenging space, but also deeply rewarding when disconnects are exploited. We had such an opportunity in 2019, with +72% average model returns.
Recent market carnage has reopened these opportunities while cycle fundamentals remain solid for our top picks. We’ve had a rough start in 2020, but we’re volatility veterans. I expect investors will once again thrive with selective picks.
It’s Free! Click here to Subscribe!
Source: Seeking Alpha


